Two numbers hiding behind one feature name
In December 2023, a team of UC Berkeley researchers published LLMCompiler, a framework for scheduling an LLM agent's function calls as a dependency graph instead of a strict sequence. Benchmarked against ReAct-style sequential execution, the paper reports a consistent latency speedup of up to 3.7x, cost savings of up to 6.7x, and an accuracy improvement of roughly 9%. Source: Kim et al., "An LLM Compiler for Parallel Function Calling," ICML 2024. Those numbers get quoted constantly as evidence that parallel tool calling is a free win. They are real, and they are also two different mechanisms wearing one name, which is why so many teams ship the first one and never notice they left the second one on the table.
Both Anthropic's and OpenAI's APIs have supported parallel tool calling for about two years. By default, Claude may return several tool_use blocks in a single response, and OpenAI's parallel_tool_calls parameter defaults to true for the same reason. Source: Anthropic, "Parallel tool use," Claude Platform Docs. Source: OpenAI, "Function calling," API documentation. What neither provider's docs claim is that this makes your agent faster. Anthropic's own page is explicit about it: "The API doesn't prescribe an execution order: you can run the calls concurrently, sequentially in the order they appear, or in any combination that suits your tools." The model batching its proposal into one turn and your code running those calls at the same time are two separate decisions, and only one of them is the model's.
The two levers, and what each one actually moves
The confusion is worth untangling before touching a chart, because the fix for each lever is different and neither one substitutes for the other.
Turn-count reduction. When a model proposes four tool calls in one response instead of across four separate turns, your agent pays the fixed cost of a model turn, the system prompt, the tool schemas, the accumulated history, once instead of four times. That is a token and dollar saving. It happens the moment the model batches the proposal, and it happens whether your code then runs those four calls one after another or all at once.
Execution concurrency. When your code runs those four calls with asyncio.gather or Promise.all instead of awaiting them in a loop, the wall-clock time collapses from the sum of four round trips to roughly the slowest one. That is a latency saving, and it depends entirely on how the calling code is written. The API returning four tool-call proposals in one turn does not make your for-loop concurrent. It just gives the for-loop four things to iterate over instead of one.
| Architecture | Model turns for 4 calls | How the 4 calls execute | What it saves |
|---|---|---|---|
| Sequential (ReAct-style) | 4 decision turns + 1 synthesis | One at a time, each gated by a model turn | Neither |
| Batched proposal, sequential execution | 1 decision turn + 1 synthesis | One at a time, in a loop | Tokens and cost, not latency |
| Batched proposal, parallel execution | 1 decision turn + 1 synthesis | Concurrently | Tokens, cost, and latency |
| Optimized pipeline | 1 decision turn + 1 synthesis | Concurrently, with selective reads and cache hits | All three, plus reduces what gets read |
The second row is the one worth checking your own codebase against. It is the easiest state to end up in by accident: you adopt an SDK that already batches tool-call proposals, you feel the token bill drop, and you conclude the parallel tool calling box is checked. The loop that executes those calls is still a for loop.
Concurrency, not batching, is what collapses wait time
Here is what the two levers do to wall-clock time on an illustrative agent step: a plan-then-act loop that needs four independent lookups, each a separate tool call, before it can synthesize an answer. The model below assumes a 0.6 second average tool round trip and a 1.2 second average model turn, both illustrative figures, not measurements from a specific vendor or benchmark.
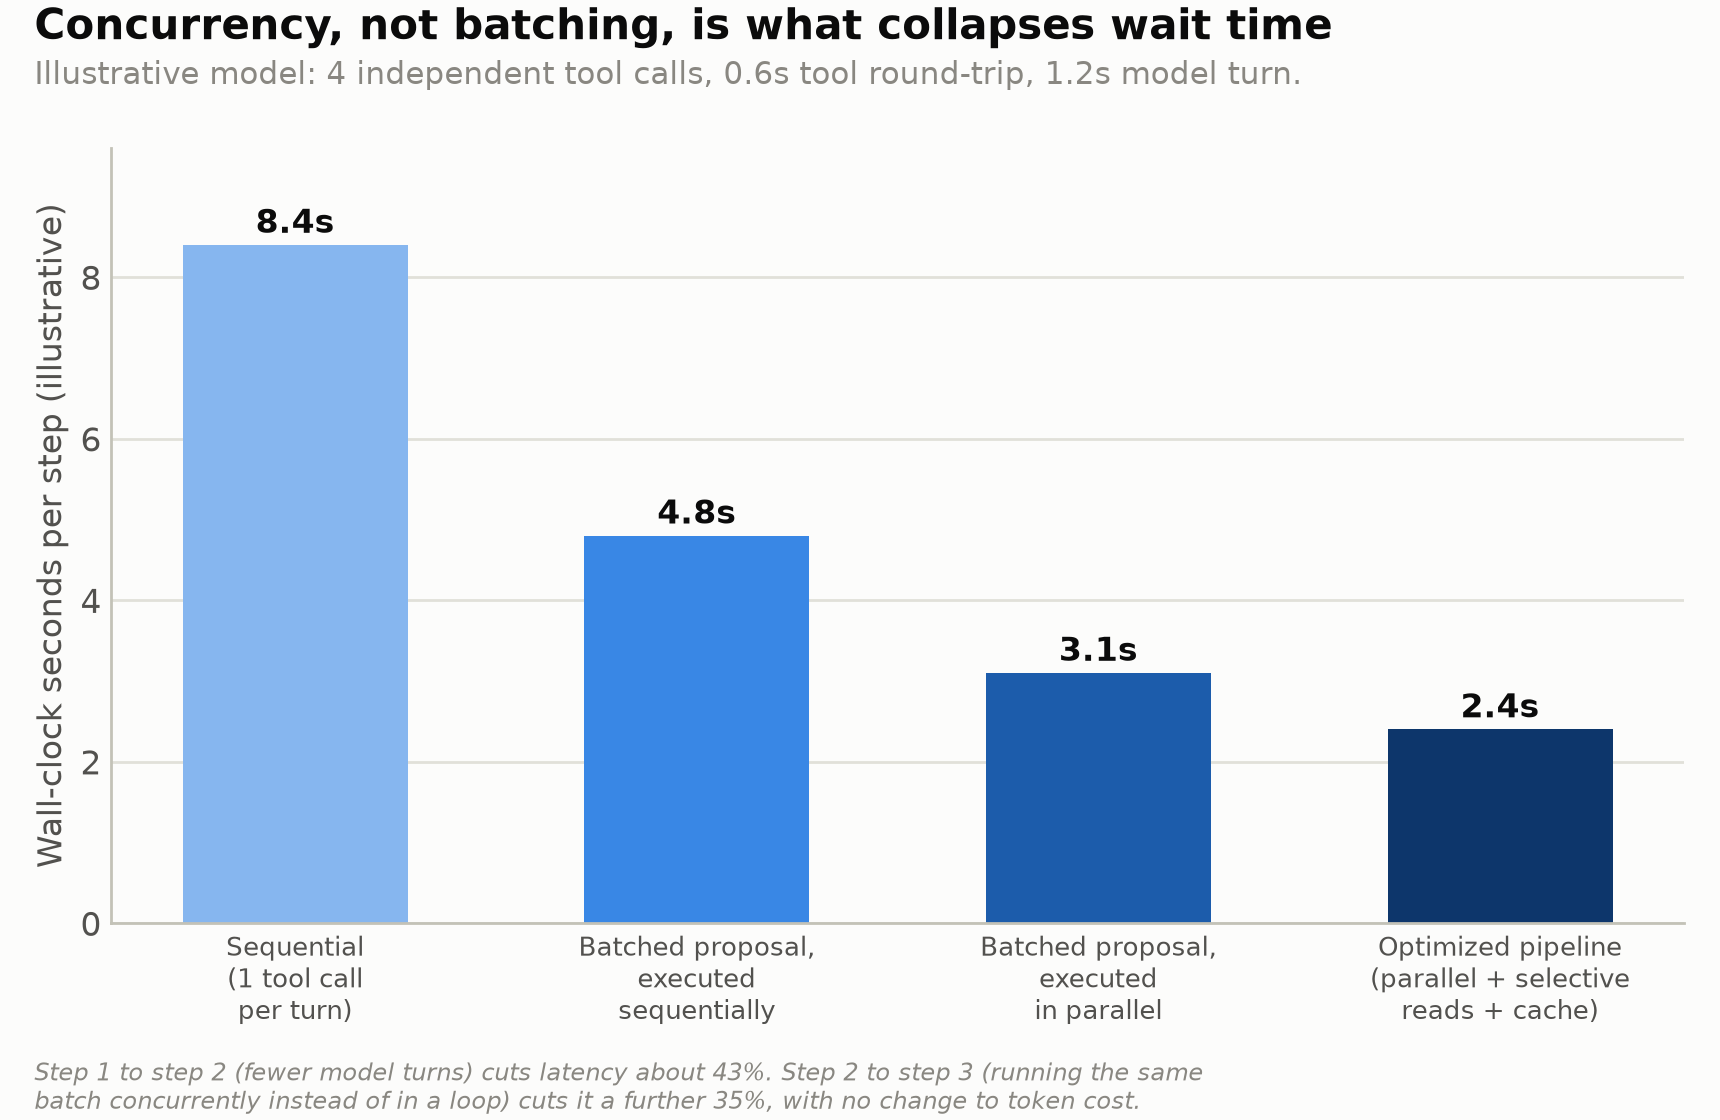
Going from sequential to batched cuts latency by cutting model turns, about 43% in this model. Going from batched-sequential to batched-parallel cuts it again, about 35% further, for a completely different reason: the tool round trips stop queuing behind each other. Anthropic's own guidance on when to take that second step is a useful filter: "Independent, read-only operations are usually safe to run in parallel for lower latency. Tools with side effects, shared state, or ordering requirements might be better run sequentially." Source: Anthropic, "Parallel tool use," Claude Platform Docs. Four independent web searches clear that bar easily. Four sequential writes to the same record do not, and running them concurrently anyway is how agents end up racing themselves.
What batching alone saves, and does not
Turn-count reduction is a real saving, and it is worth separating from concurrency because it shows up in a different place: the token bill, not the clock. The same illustrative step, broken down by where the tokens actually go:
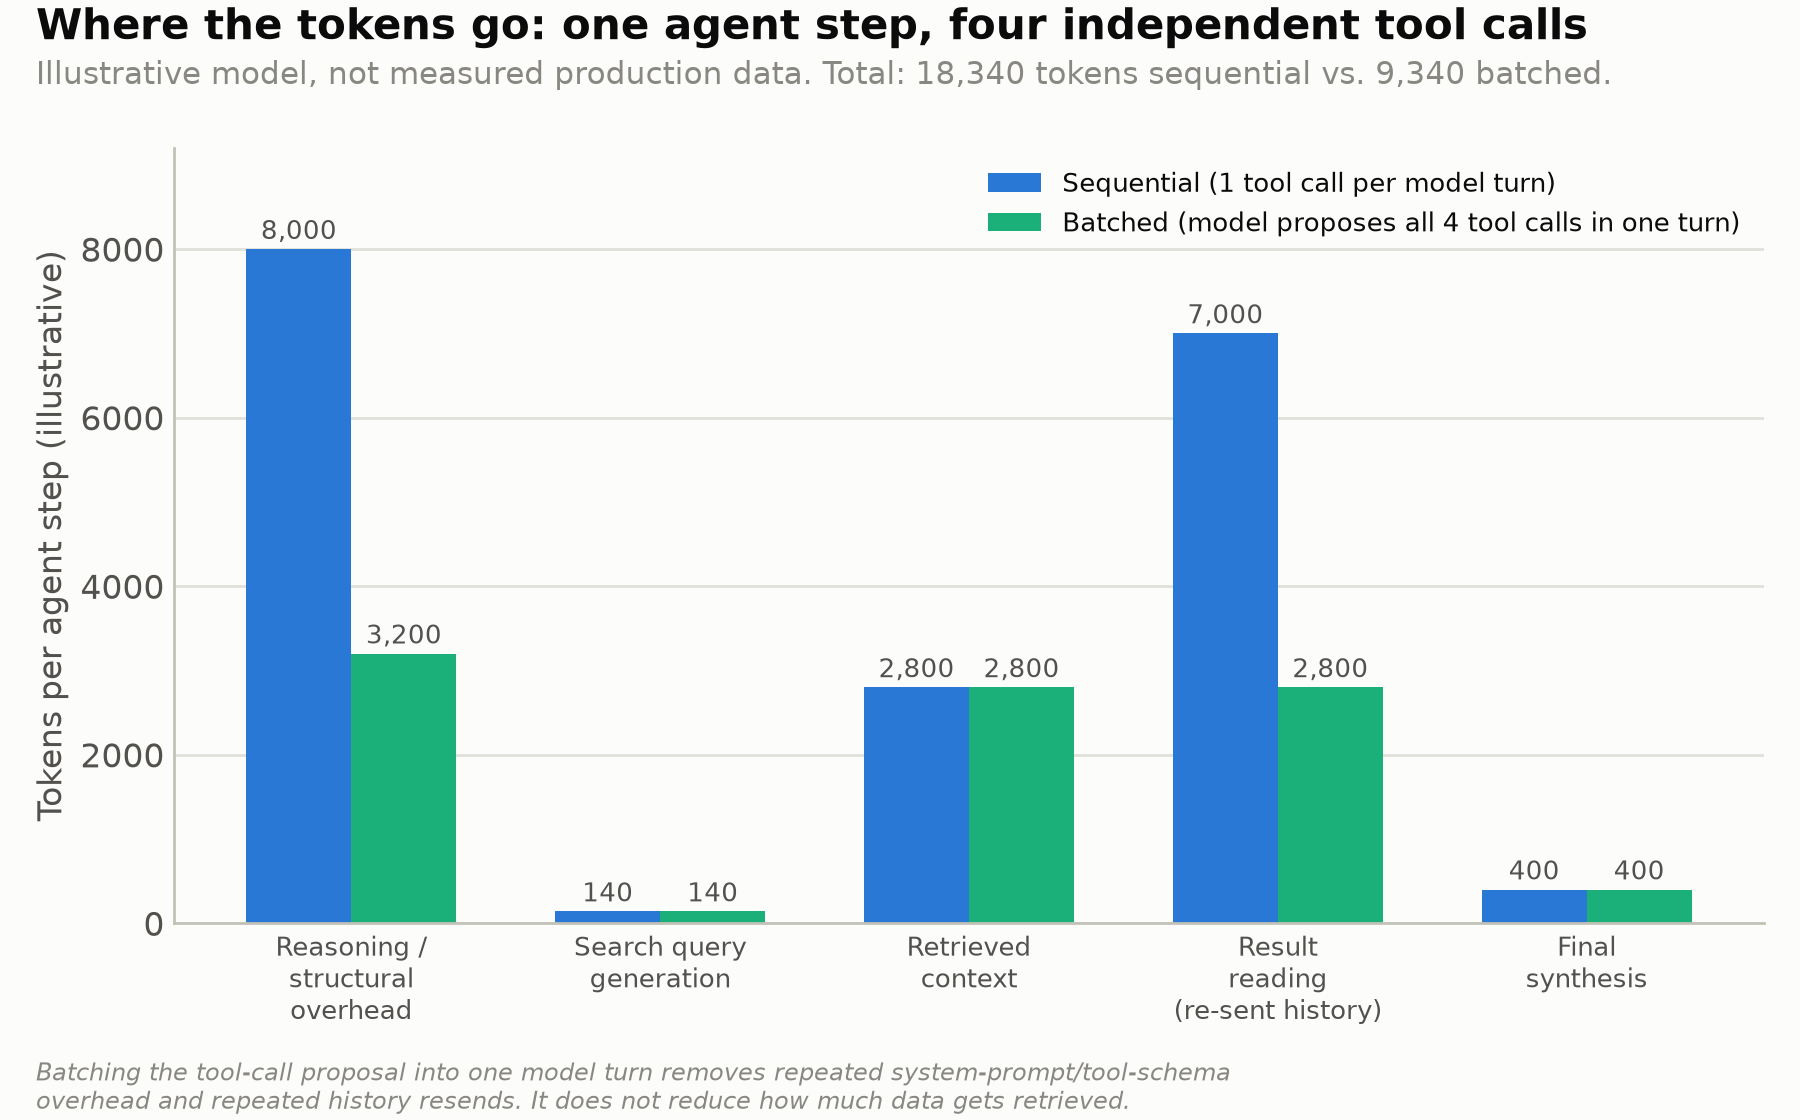
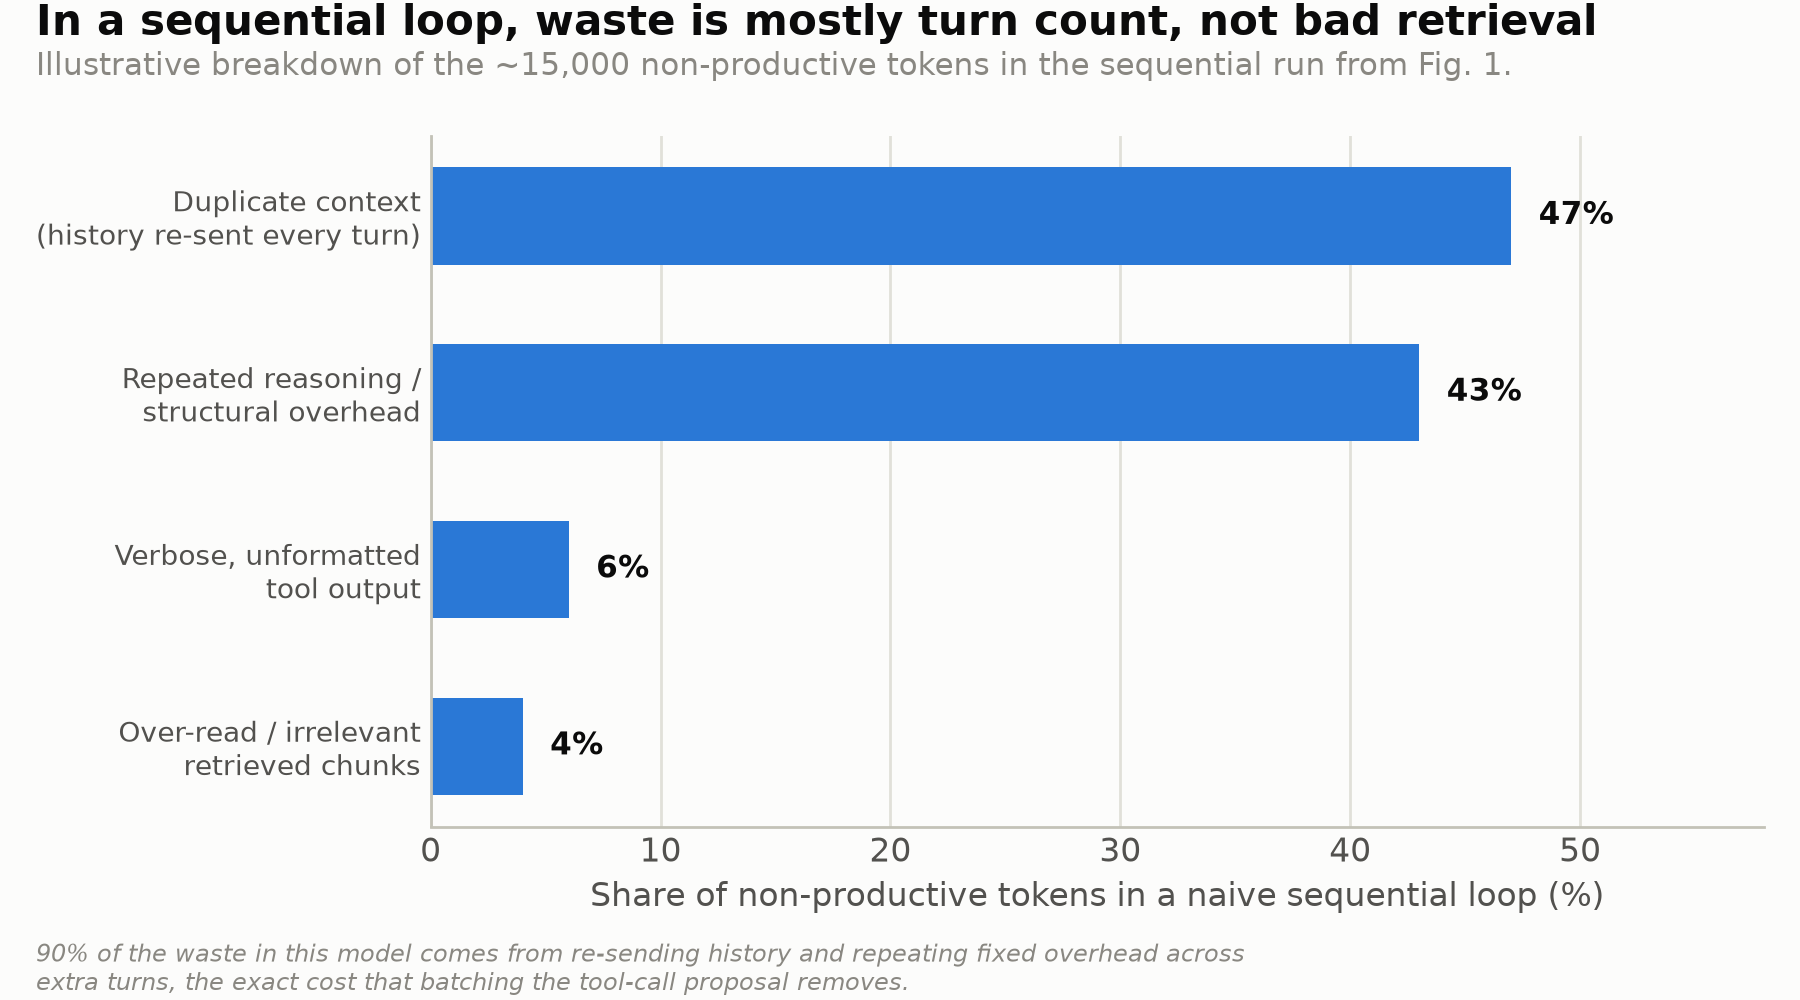
Two of the five categories shrink when the proposal is batched: the fixed system-prompt and tool-schema overhead that gets resent on every model turn, and the accumulated history that grows every time a prior tool result has to be restated for the next turn to see it. Both of those costs are purely a function of how many turns the loop takes. This blog has already measured the first one directly: a ReAct-pattern research agent spends 82% of its token budget before writing a word of the actual answer, and tool schemas alone can burn well over 100,000 tokens of context before an agent with a few MCP servers connected does any work. Batching the proposal does not touch either of the other two categories: retrieved context is identical in both rows, because the same four calls fetch the same four results either way. Batching changes how many times the loop pays the toll booth. It does not change how much cargo crosses the bridge.
Where the dollar cost actually drops
Extending the same model to cost, at blended premium-model rates against a 10x cheaper model for delegated sub-work, makes the two-lever split even sharper:
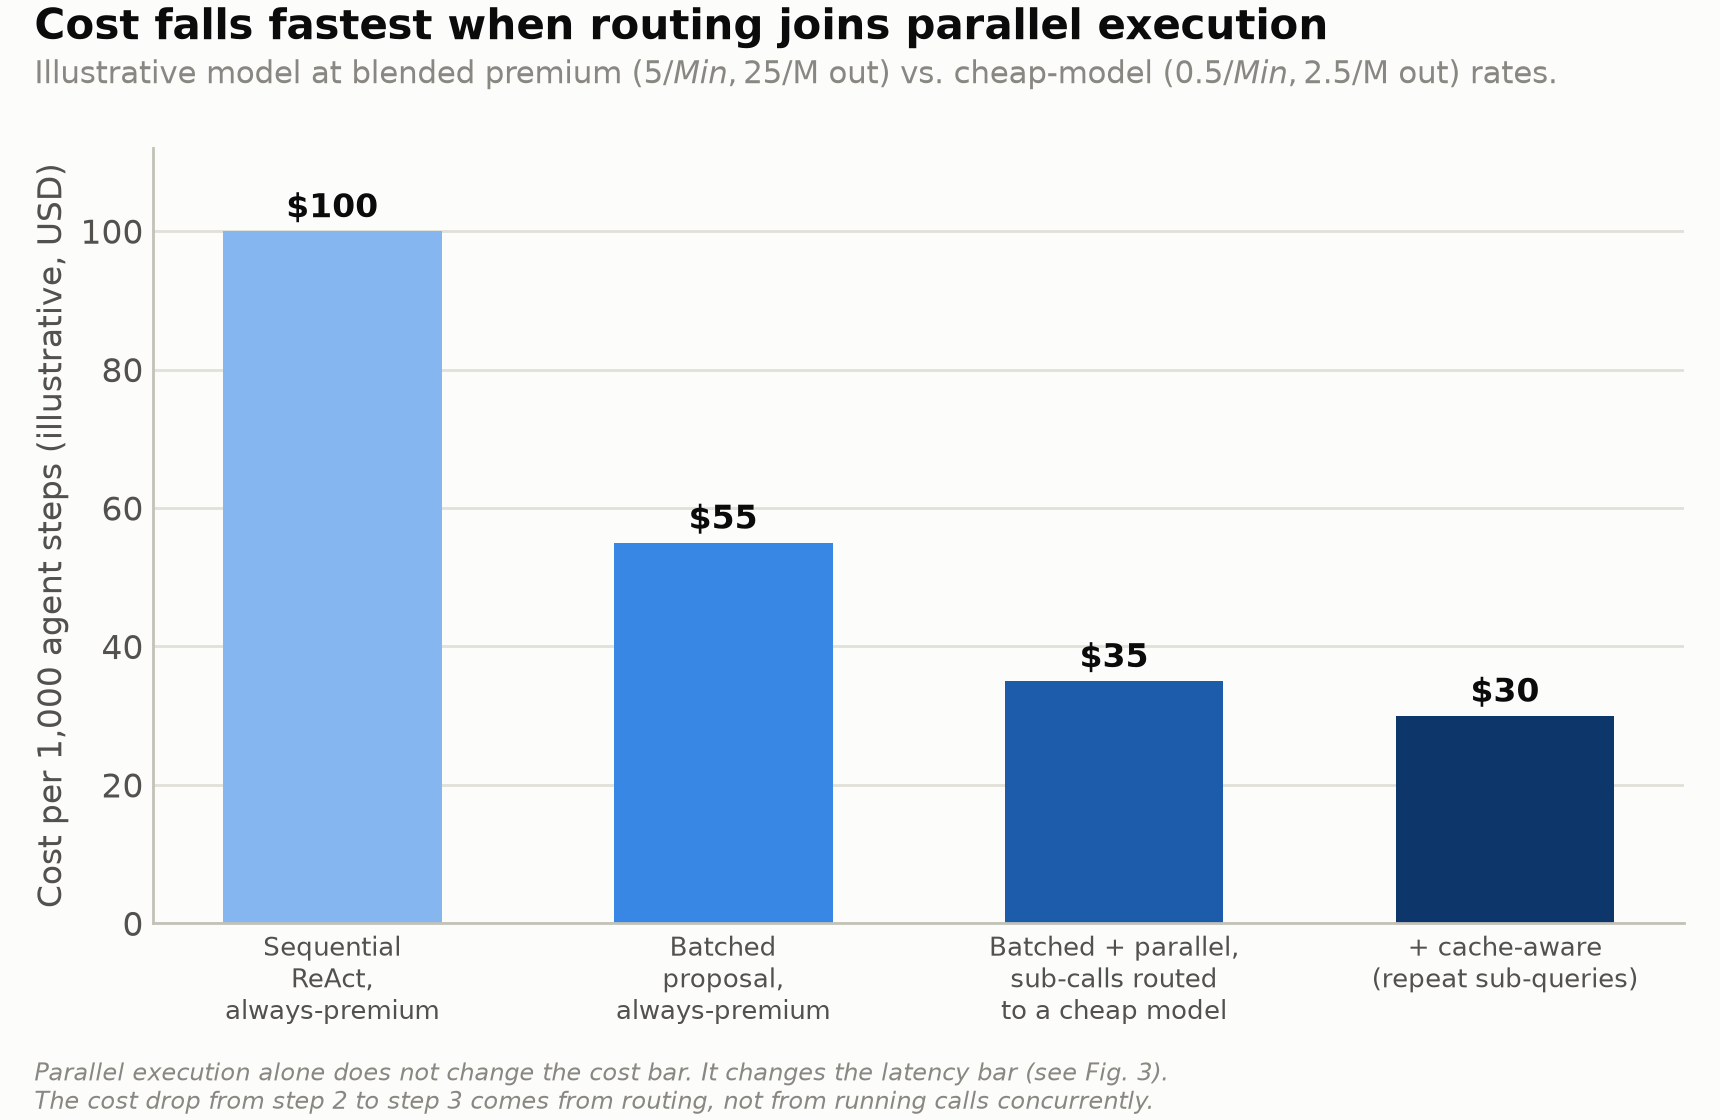
Notice what does not move: going from batched-sequential to batched-parallel execution, the step that collapsed latency in the earlier chart, leaves the cost bar almost untouched, because concurrent execution changes when the tokens get spent, not how many get spent. The real cost drop between those two configurations comes from a decision this chart bundles in alongside it: routing the interior sub-calls, the per-result summarization and formatting work inside the batch, to a cheaper model instead of the one doing the planning. The same principle that makes multi-agent orchestration expensive applies here at a smaller scale: pricing every sub-step at the coordinator's rate is where the multiplier comes from, and routing the sub-steps individually is what removes it. Cache-aware handling of repeated sub-queries adds a further, smaller cut, useful specifically when the same lookups recur across steps or across users, not a fixed percentage you can assume applies to a one-off task.
The failure modes nobody draws in the diagram
None of the above is a reason to parallelize and route everything by default. Four ways this goes wrong in production:
- Parallel calls complicate failure handling. If one call in a batch of four fails or returns something that contradicts another, the loop needs a resolution step that a strictly sequential design never has to build, because a sequential loop can just stop. Anthropic's tool-use format accounts for this directly, requiring a
tool_resultfor everytool_useblock even when a call was never executed, markedis_error: truewith an explanation. Skipping that bookkeeping is how a batched loop silently drops a result instead of failing loudly. - Not every tool call is safe to run concurrently. Independent reads parallelize cleanly. Calls with side effects, shared state, or a required order do not, and Anthropic's own guidance on agent workflow patterns says the same about parallelization broadly: avoid it when subtasks need to build on each other's work or when agents can't reliably coordinate changes to shared state while running simultaneously.
- Small-model-first without verification is the cheapest point on the chart and the riskiest. Routing every sub-call to a cheap model with nothing checking its output is how a team gets the $18-per-1,000-steps number and then spends more than it saved on retries when the cheap model gets something wrong that a verification step would have caught before it shipped.
- Compression is not a substitute for routing, and it is not free. Prompt compression can cut input token bills 3 to 5x in production, but applied indiscriminately before the model has decided what matters, it risks compressing away the one detail a later step actually needed.
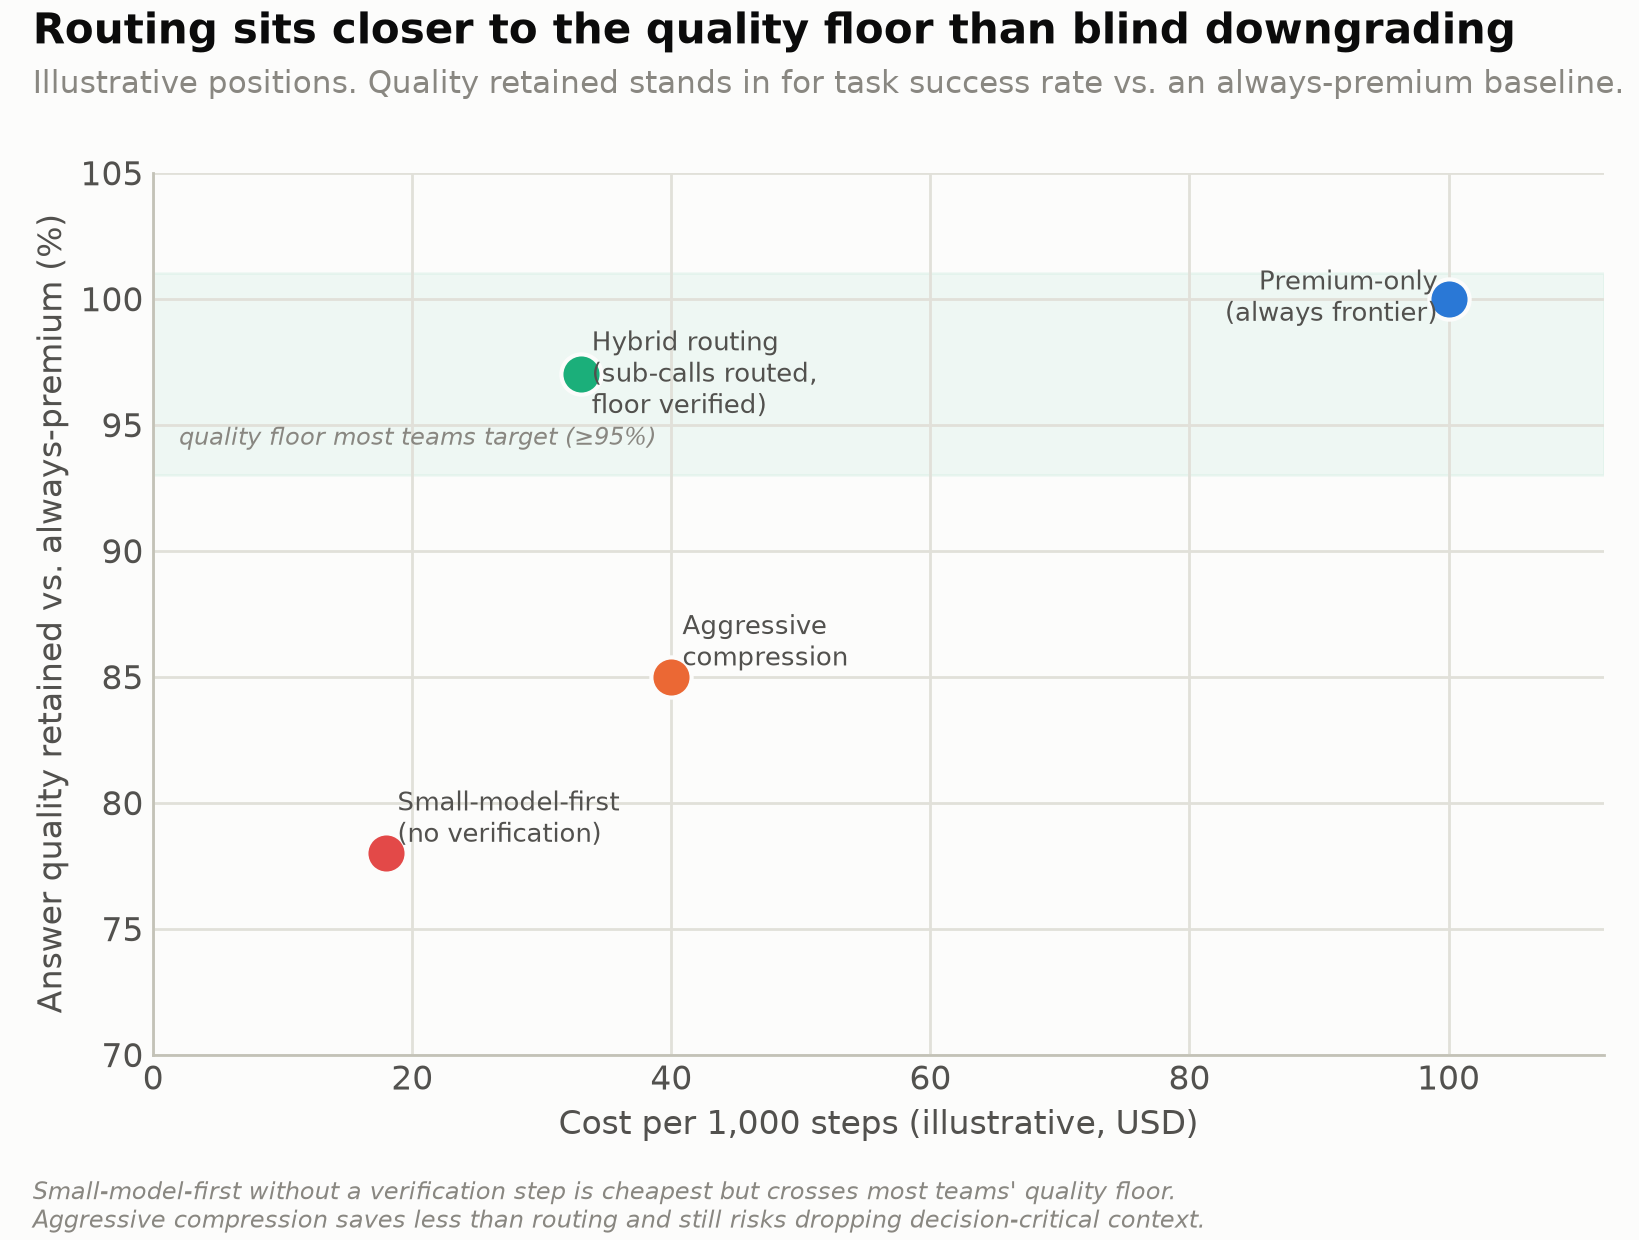
Hybrid routing lands closest to the quality floor most teams actually target, not because routing is magic, but because it keeps the planning and synthesis turns, the steps that need real reasoning, on the model that can do it, and only delegates the interior sub-calls a verification step can catch if they go wrong. The same logic underlies routing without a verifier being closer to a coin flip than a decision: a router that doesn't check its own cheap-model output is a small-model-first strategy with better branding.
What actually closes the gap
- Audit whether your loop is actually concurrent. Grep for how tool-call results get awaited. A batched proposal executed inside a
forloop is still paying the full latency cost of sequential execution. - Classify tool calls by side effects before parallelizing. Independent reads default to concurrent. Anything with shared state, ordering requirements, or write effects stays sequential or gets its own coordination logic.
- Route the interior of the batch, not just the entry point. The turn that plans the batch and the turn that synthesizes the final answer are the two that plausibly need a frontier model. Everything executed inside the batch is a separate routing decision.
- Cache the sub-queries that actually repeat. A cache is a bet that the same lookup recurs. It pays off across a stream of similar tasks and does nothing for a one-off.
- Verify before shipping a routed sub-call's answer. A confidence check that escalates on a miss is what keeps hybrid routing near the quality floor instead of next to small-model-first on the chart above.
- Track latency and cost as two separate lines, not one dashboard tile. They respond to different fixes. Conflating them is exactly how a team ships concurrency and reports it as a cost win, or ships routing and reports it as a speed win.
What that looks like in a request
None of this requires a new framework, just running the batch concurrently and routing what runs inside it:
import asyncio
import openai

client = openai.OpenAI(
    base_url="https://api.getnadir.com/v1",
    api_key="ndr_...",
)

# The planning turn that proposes the batch, and the final synthesis
# turn, are the two steps that plausibly need frontier reasoning.
async def run_batch(tool_calls, execute_tool):
    # Concurrency is the caller's decision, not the model's. This is
    # what turns a batched proposal into collapsed wait time instead
    # of a for-loop shaped exactly like ReAct.
    return await asyncio.gather(*(execute_tool(tc) for tc in tool_calls))

# Every per-result summarization call inside the batch is scored
# independently against the cheapest model that can handle it, not
# against the model that planned the batch.
response = client.chat.completions.create(
    model="auto",
    messages=[{"role": "user", "content": summarize_result_prompt}],
)
Nadir can shadow each interior summarization call and return model, effort, cache, context, and policy evidence without making a provider call. Join each receipt to actual batch usage and outcomes before enforcement. Complete non-streaming responses can optionally enter the verifier; streaming calls bypass post-generation verification.
Conclusion
Parallel tool calling earned its reputation honestly. LLMCompiler's 3.7x latency and 6.7x cost numbers are real results, not marketing rounding. The part that gets lost in the citation is that they come from two different changes bundled into one paper: fewer model turns, which both major APIs now hand you by default, and concurrent execution of the resulting batch, which is still a decision your code has to make on its own. Most teams got the first one for free when they upgraded SDKs and never checked whether their tool-execution loop actually runs concurrently. The second one is a few lines of asyncio.gather, and pairing it with routing the batch's interior calls is what turns a latency fix and a cost fix into the same commit instead of two separate ones nobody gets around to shipping.
Related reading
- Your AI research agent spends 82% of its token budget before writing a single word of the answer.
- Every MCP server your agent connects to loads its full tool catalog on every call.
- Multi-agent AI costs 15x more, and almost nobody routes it.
- Routing without verification is dead-reckoning.
- Compression saves you once. Routing plus compression saves you twice.
Sources: [Kim, Moon, Tabrizi, Lee, Mahoney, Keutzer, Gholami, "An LLM Compiler for Parallel Function Calling," ICML 2024, arXiv:2312.04511](https://arxiv.org/abs/2312.04511). [Anthropic, "Parallel tool use," Claude Platform Docs](https://platform.claude.com/docs/en/agents-and-tools/tool-use/parallel-tool-use). [Anthropic, "Building Effective AI Agents," December 19, 2024](https://www.anthropic.com/engineering/building-effective-agents). [OpenAI, "Function calling," API documentation](https://developers.openai.com/api/docs/guides/function-calling). [Lin, Liew, Savarese, Li, "W&D: Scaling Parallel Tool Calling for Efficient Deep Research Agents," February 2026, arXiv:2602.07359](https://arxiv.org/abs/2602.07359). All latency, token, and cost figures presented as an "illustrative model" are back-of-envelope calculations from the stated assumptions, not measured production traces or a specific vendor benchmark.