Same GPU, same model, same weights. A 72x spread in what it actually costs.
A paper published to arXiv on June 10, 2026 ran 42 benchmarks across dense and mixture-of-experts model architectures on identical H100 hardware and measured something almost nobody prices in ahead of time: the effective cost of a self-hosted LLM, in dollars per million output tokens, ranged from $0.21 to $15.25. Same chip. Same model family. Same quantization. The only thing that moved was how busy the fleet was when the request showed up. Source: Patil, "Beyond Per-Token Pricing: A Concurrency-Aware Methodology for LLM Infrastructure Cost Estimation," arXiv:2606.11690, June 2026.
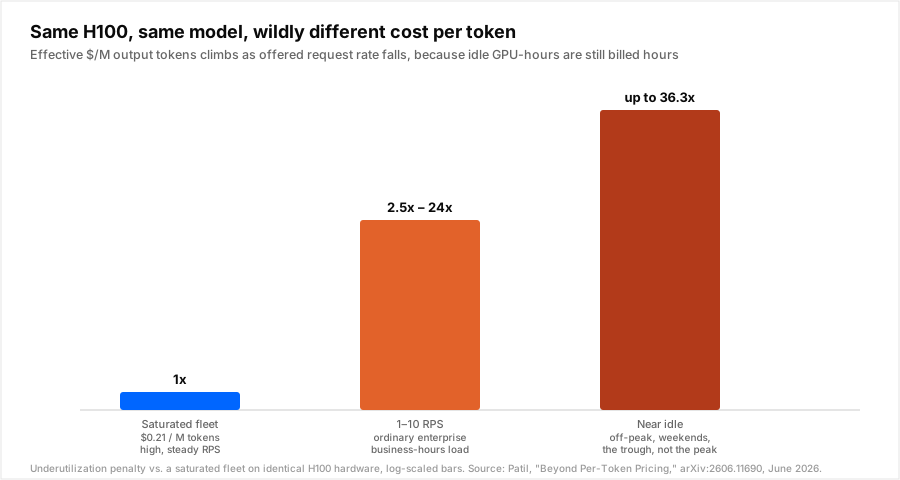
At ordinary business-hours load, 1 to 10 requests per second, which is a realistic range for a mid-sized enterprise deployment, the underutilization penalty against a saturated fleet runs 2.5 to 24x. Near idle, the penalty climbs to as much as 36.3x. A cross-check on A100 80GB hardware reproduced the same load-driven spread at 7.0 to 11.4x, so this isn't an H100 artifact. It's a property of how GPU-based inference gets billed.
Every public LLM cost calculator you have ever used treats GPU utilization as a input you set once, usually left at whatever number makes the self-hosted number look good next to the API rate card. This paper's actual finding is that utilization isn't a setting. It's the whole story.
Why a busy GPU and an idle GPU bill the same hour differently
The mechanism is not exotic. You rent a GPU by the hour. That hour costs the same dollar amount whether the chip spends it fully batched across dozens of concurrent requests or sitting mostly idle waiting for the next one to arrive. The cost per output token is just that hourly rate divided by however many tokens the chip actually produced in that hour, and that number depends entirely on how many requests were in flight at once.
Little's Law gives the exact relationship: the average number of requests in a system equals the arrival rate multiplied by the average time each request spends being served. Applied to an inference fleet, the rate of requests an operator offers to their servers directly sets in-flight concurrency, concurrency sets batch size, and batch size sets GPU utilization. The paper formalizes this as an effective-cost function of hardware, model, quantization, request rate, and latency target, and shows that existing calculators, which fix utilization instead of deriving it from request rate, understate true cost by a factor that's exactly the inverse of that missing utilization term.
None of this is a criticism of any specific GPU vendor or serving stack. It's an argument that the number on a self-hosting cost calculator and the number on your actual invoice are two different measurements, and the gap between them is set by your traffic pattern, not your infrastructure choices.
The load you can't smooth away
The paper's numbers describe steady, sustained request rates. Real workloads rarely hold still at one rate for long, and agentic traffic is the worst-behaved kind there is. A support chatbot has a diurnal curve: busy during business hours, close to idle overnight. A coding agent has a product-driven curve on top of that: a team merges a big refactor and the fleet spikes, then nothing for six hours. Coding agents already burn 1,000x more tokens than chat per session, and none of that volume arrives on a schedule a capacity planner can smooth in advance.
A fleet has to be sized for the peak, or requests queue and latency SLAs break. Sizing for the peak means the fleet runs below that peak, meaning underutilized, for most of every day it operates. That's not a mistake anyone made. It's the tradeoff every capacity-planning discipline has always faced, just now priced in dollars per million tokens instead of hidden inside a GPU-hour line item nobody read closely. The same operational reality shows up in the classifier-hosting cost of running your own routing gateway: the hardware you provision for the worst hour is expensive for all the other hours too.
What this actually costs at a few traffic shapes
Modeled on the paper's reported multipliers, on identical hardware, holding the model and quantization fixed:
| Fleet condition | Effective $/M output tokens | Multiplier vs. saturated |
|---|---|---|
| Saturated, high steady RPS | $0.21 | 1x (baseline) |
| Ordinary business-hours load, 1-10 RPS | $0.53 to $5.04 | 2.5x to 24x |
| Near idle, overnight or off-peak | up to $15.25 | up to 36.3x (paper's reported peak) |
Two things worth sitting with. First, "ordinary business-hours load" isn't a stress case, it's the load level most self-hosted enterprise deployments actually run at most of the day. That's the range where the penalty is already 2.5x to 24x. Second, nobody targets near-idle on purpose, but every fleet passes through it every night and every weekend, and the paper's methodology counts that time the same as any other hour, because the GPU rental invoice does too.
Where a rate-card API sidesteps the whole problem
A hosted API provider doesn't have this problem, or more precisely, they have it and you don't. They pool request volume across every customer on the platform simultaneously, so the $/M-token number on the rate card reflects their fleet-wide utilization, not any single customer's traffic shape. A team calling the API at 1 request per second at 3am and a team sending a 200-request burst at 2pm both pay the same published rate, because the provider, not the customer, is the one managing the utilization curve underneath it. That pooling is a large part of what a rate card actually is: someone else absorbing exactly the variance this paper measured.
That reframes the self-host-versus-API decision. It was never purely a per-token price comparison between a GPU rental rate and an API rate card. It's a bet on whether your own traffic is steady and large enough to keep a self-hosted fleet close to saturated, which is exactly the condition under which self-hosting's per-token cost genuinely beats a hosted rate card. Most product traffic, and nearly all agentic traffic, isn't steady. It's spiky in ways that track user behavior, not server capacity.
This doesn't disappear if you self-host anyway
None of this is an argument against self-hosting. Teams with large, steady, predictable volume, batch pipelines, high-traffic internal tools, workloads that genuinely run near-saturated most of the day, are exactly who the paper's low end applies to, and for them self-hosting at $0.21/M tokens against a marked-up API rate is a real, durable win. The paper even ships the tool to go measure it: vllm-cost-meter, an open-source cost meter that attaches to a live vLLM server and reports the real dollars-per-million-tokens number your fleet is actually running at, not the one a spreadsheet assumed.
What the utilization math doesn't remove is the scheduling problem sitting on top of it. If part of your fleet is self-hosted and part of your traffic goes to hosted APIs, or if your self-hosted capacity varies by time of day, the question of which request goes where, right now, given current load, is still a routing decision. Nadir runs that decision layer either way: hosted, so your traffic gets priced against whichever provider's fleet is currently well-utilized instead of your own trough hours, or self-hosted and on-prem, routing across your own infrastructure so the requests that can wait land on the fleet that's already warm instead of spinning up idle capacity to meet them.
What to actually check before you trust a self-hosting estimate
- Measure your real RPS distribution, not your peak. A capacity plan built off peak-hour throughput will always understate cost, because most hours aren't peak hours.
- Run the number against your live traffic, not a vendor benchmark.
vllm-cost-meteror an equivalent live-server cost meter gives you the number your actual utilization curve produces, which is the only number worth comparing against an API rate card. - Separate steady workloads from bursty ones. A batch pipeline running near-saturated all day and an agentic product with a diurnal, product-driven traffic shape do not belong on the same cost model, and probably shouldn't share the same hosting decision either.
- Price the trough, not just the peak. The hours your fleet spends underutilized are not free just because nobody is watching the dashboard then. They're on the same invoice as the busy hours.
- Don't assume self-hosting or hosted APIs is a one-time decision. Traffic shape changes as a product grows. A workload that justified self-hosting at last year's volume can look very different once agentic usage multiplies request counts the way multi-agent workflows already do.
Bottom line
The per-token price on a GPU cost calculator and the per-token price on your actual invoice are two different numbers, and the paper's contribution is showing exactly how far apart they can get: up to 72x on identical hardware, driven entirely by how busy the fleet is when a request lands. That's not a hardware problem or a model-choice problem. It's a traffic-shape problem, and most product traffic, agentic traffic especially, doesn't hold still long enough to keep a self-hosted fleet saturated. If your volume is steady and large, the low end of that range is real and worth capturing. If it isn't, the utilization tax is already priced into whoever's rate card you're comparing against, because pooling that variance across every customer is most of what a hosted rate card is for.
Start free and let routing handle which fleet, hosted or your own, gets each request while it's actually busy enough to be worth it.
Data in this post is illustrative, modeled on the multipliers and ranges reported in the cited paper, not derived from proprietary production traces. Sources: [Patil, "Beyond Per-Token Pricing: A Concurrency-Aware Methodology for LLM Infrastructure Cost Estimation," arXiv:2606.11690, June 10, 2026](https://arxiv.org/abs/2606.11690).