Abstract.
On July 1, 2026, researchers at the University of Washington released TraceLab, the first published trace of real, day-to-day coding-agent usage: roughly 4,300 sessions, about 350,000 LLM steps, and 430,000 tool calls, pulled from their own live Claude Code and Codex work rather than a synthetic benchmark. Its headline ratio is stark. A median step in that trace carries back 119,000 tokens of prior context (the prefix) to append just 875 new tokens and generate 214 output tokens, roughly two orders of magnitude more re-read than new work, on every single call. This post treats that ratio as the starting point for a cost, latency, and quality model of the coding-agent loop: grep or glob to search, read files back in full, interpret the results, edit, verify, repeat. Layering TraceLab's own measured 95.7% prefix cache hit rate and SWE-Pruner's published 23-54% context-compression range onto that model shows caching the carried prefix, not swapping the model, is the largest single lever available, and that a naive small-model-first strategy is not automatically cheaper once retries are counted. The practical implication: instrument what a coding agent reads before deciding what to cut or where to route it.
All charts in this post use illustrative, synthetic modeling. The 5-way token-stage split, the per-task cost figures, and the latency numbers are estimates this post constructs from published research, not measurements from any production system or proprietary trace. Where a number is drawn directly from a cited paper (TraceLab's 119K/875/214 token ratios, its 95.7% cache hit rate, SWE-Pruner's 23-54% compression range), that is stated explicitly in the text and chart footnotes. Sources cited throughout.
The ratio nobody puts on a dashboard.
Most cost-optimization advice for coding agents starts at the model level: which model, how many tokens, what does it cost per call. That framing skips a prior question that TraceLab's trace answers directly: what is a "call" actually made of.
Zhu, Jacob, Ma, Pan, Wang, Krishnamurthy, and Kasikci, "TraceLab: Characterizing Coding Agent Workloads for LLM Serving," arXiv:2606.30560 (University of Washington, July 2026) instrumented real Claude Code and Codex sessions rather than running agents against a benchmark suite, and found that "a median Claude step reads back 126k prefix tokens but appends only 857, while Codex reads 116k and appends 886, roughly two orders of magnitude more prefix tokens than append tokens." Across the full trace, the median generation workload is about 119,000 prefix tokens, 875 append tokens, and 214 output tokens per LLM call. The paper also reports that completing a typical task takes 8.8 LLM calls and 10.8 tool invocations on average, and that across both agents, three tool types (Bash, Read, and Edit for Claude Code; exec_command, write_stdin, and apply_patch for Codex) account for more than 80% of all tool calls.
None of that prefix is optional context an agent could skip reading. It is billed as input tokens on every call it appears in, whether or not the model needed most of it to decide the next action. Call this the prefix tax: the structural cost of an agent loop where searching, reading, and editing all happen by re-sending everything read so far.
Research question.
In a real trace of coding-agent workloads, how does token cost split across search, retrieval, reading, and synthesis, and which optimization techniques, caching, compression, or routing, actually reduce that cost without degrading task success?
Modeling a typical coding task on TraceLab's ratios.
TraceLab reports token ratios and call counts, not a stage-by-stage breakdown of what those tokens are spent on. To make the mechanism usable for a cost decision, this post builds an illustrative model on top of its real numbers: a typical task runs 8.8 LLM calls, and the tokens in those calls split five ways: reasoning between tool calls, the search queries themselves (grep, glob, find arguments), the file and directory content read back, the tool and test output read on the way to a fix, and the final diff plus explanation.
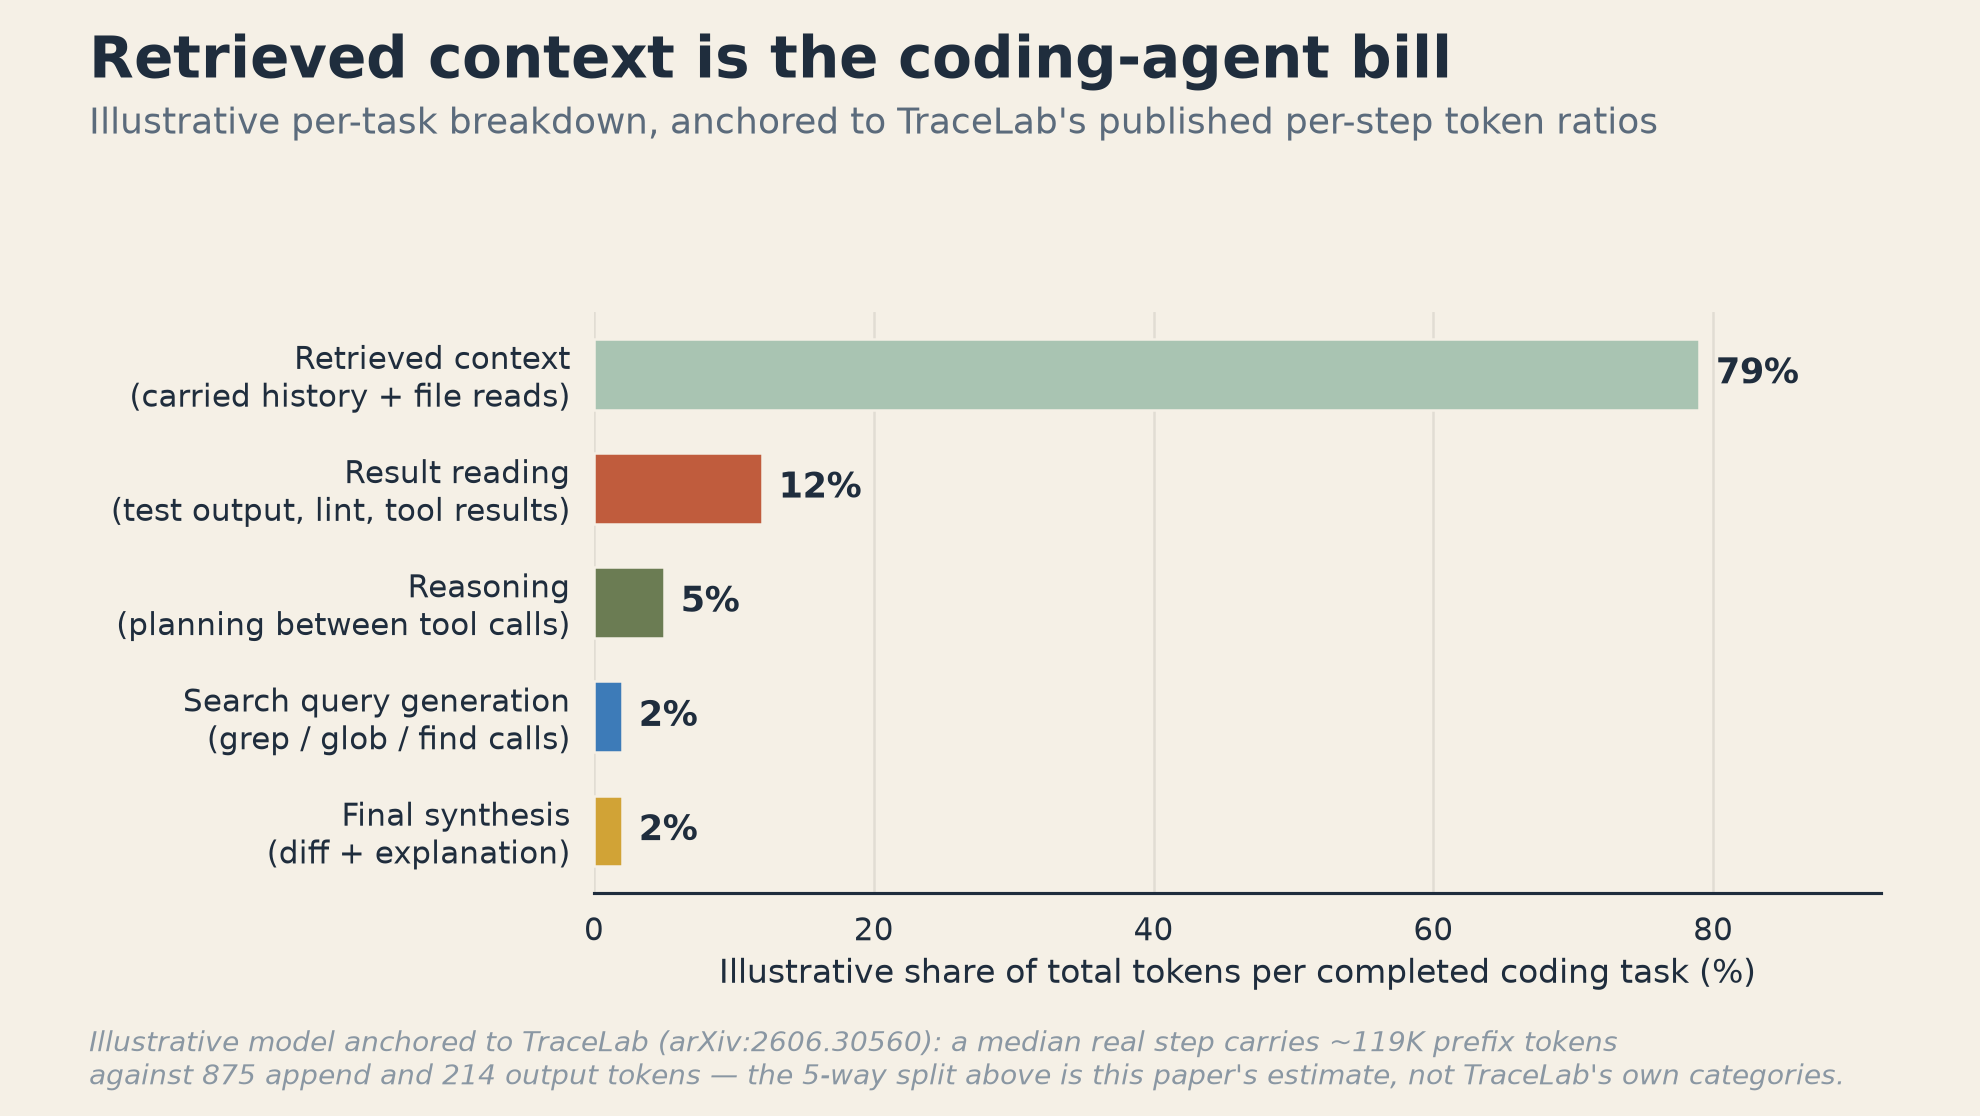
Retrieved context, the carried prefix plus whatever file content gets freshly read, dominates at an illustrative 79% of total tokens per task. That is directionally forced by TraceLab's own numbers: at 119,000 prefix tokens against 875 append and 214 output, a single call's raw ratio is closer to 99%, but a task is not one call, and later calls reuse work earlier calls already paid for once (see caching, below). The 5-way split above spreads that dominance across an 8.8-call task and estimates how the smaller "new work" categories, search query generation, reasoning, and the eventual synthesis, divide up what is left. The categories are this post's estimate, not TraceLab's own taxonomy; the underlying imbalance between what gets re-read and what gets newly generated is the paper's real, measured finding.
Cost: caching the prefix outweighs picking a cheaper model.
Four architectures, modeled on the same 8.8-call task, isolate what each lever actually buys.
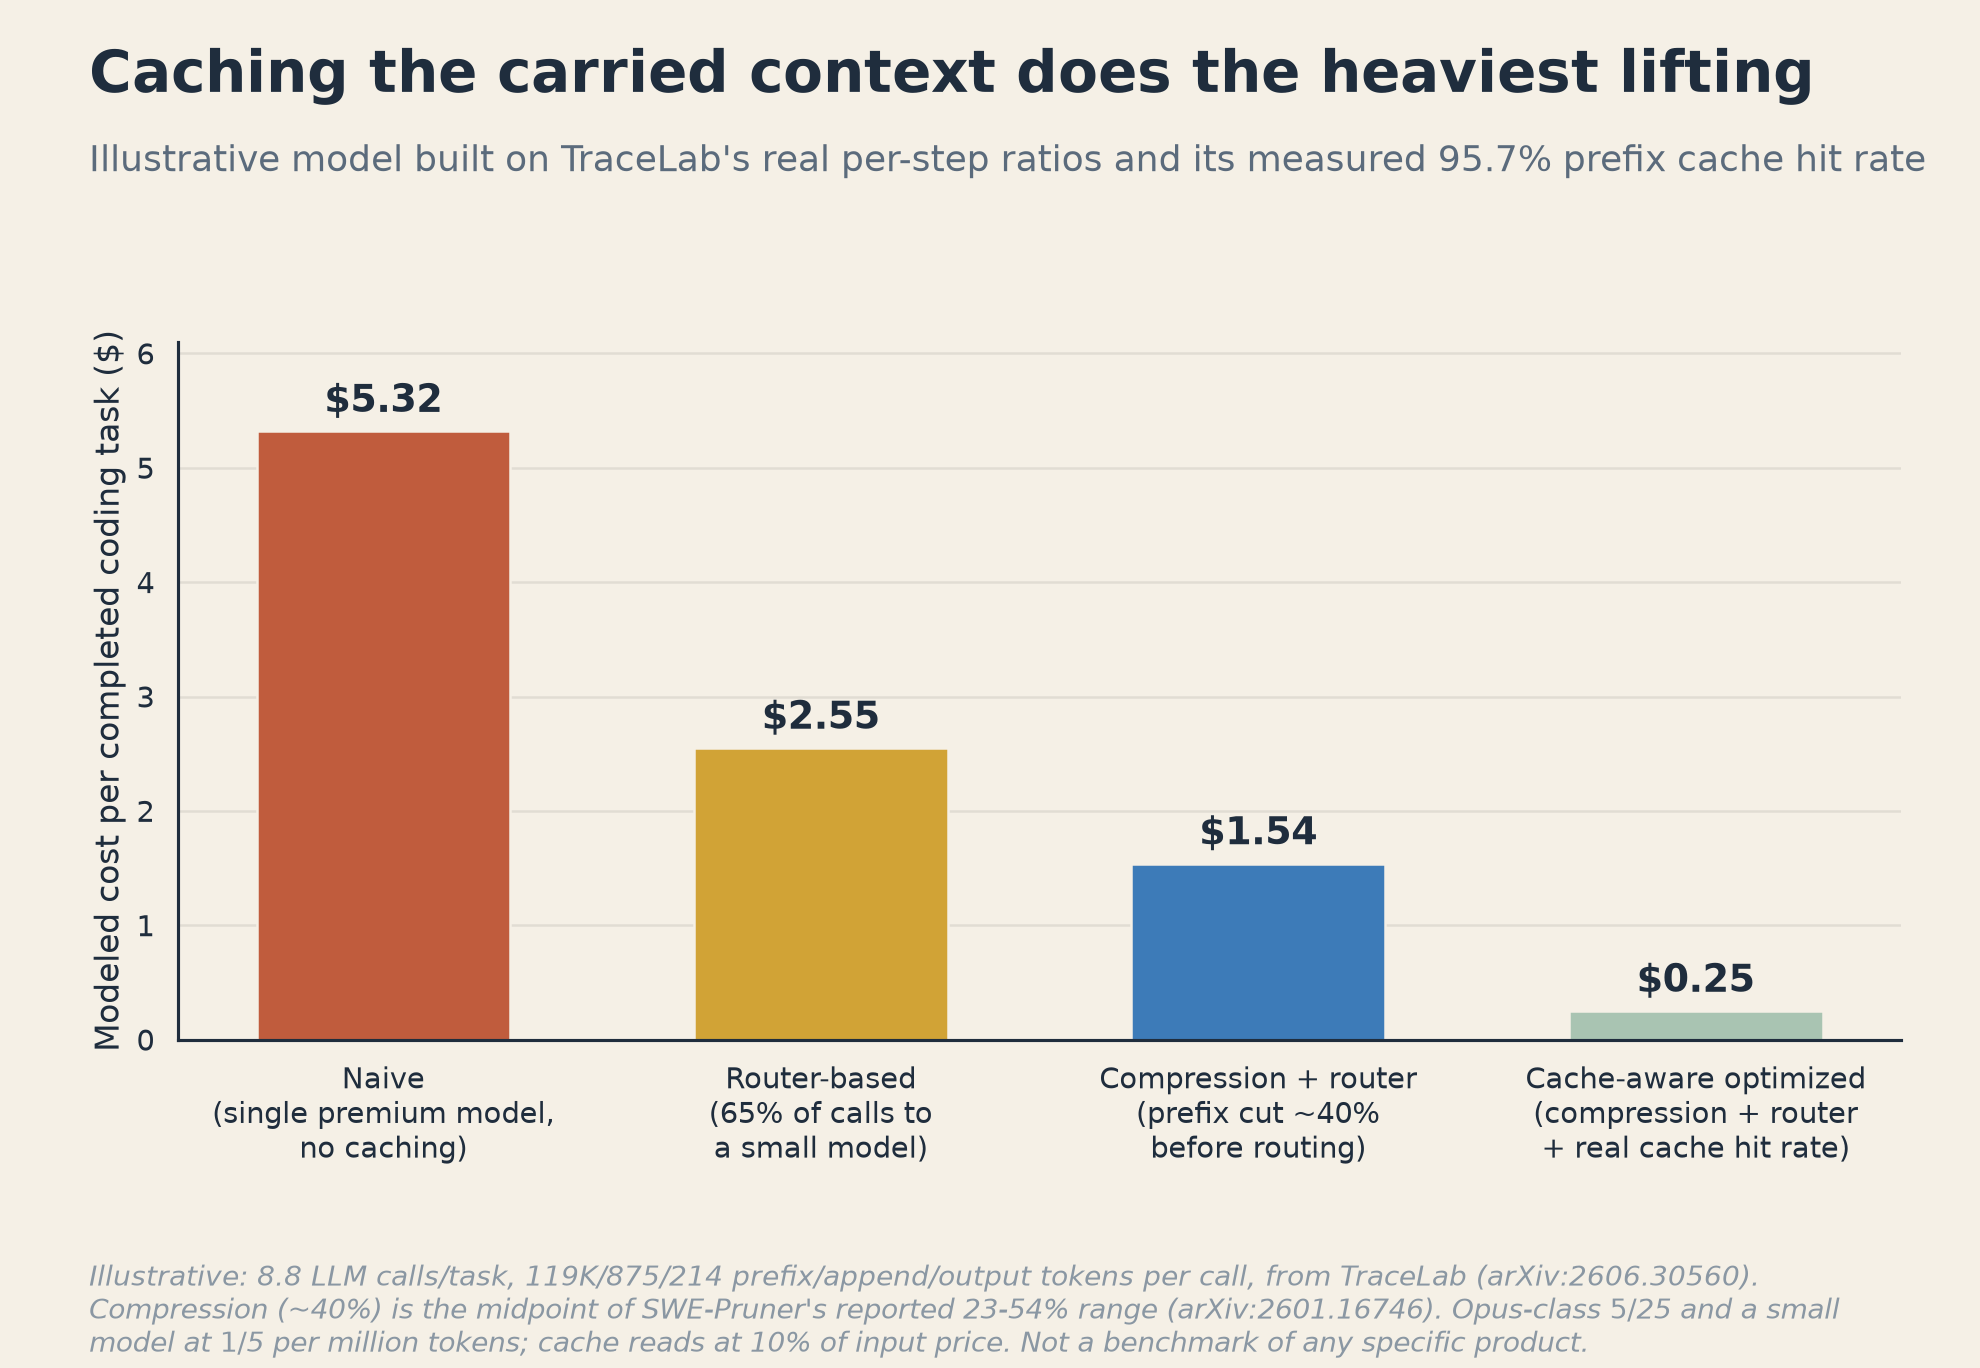
| Architecture | Cost / task | vs. naive |
|---|---|---|
| Naive: single premium model, no caching | $5.32 | — |
| Router-based (65% of calls to a small model) | $2.55 | -52% |
| Compression + router (prefix cut ~40% before routing) | $1.54 | -71% |
| Cache-aware optimized (compression + router + real cache hit rate) | $0.25 | -95% |
The model uses Opus-class pricing ($5/M input, $25/M output) and a small model at $1/M input, $5/M output, both consistent with rates used elsewhere on this blog, applied to TraceLab's real per-call token ratios over 8.8 calls. Routing 65% of calls, the mechanical file-listing and result-parsing steps, to a small model cuts cost about in half on its own. Adding context compression at roughly 40%, the midpoint of SWE-Pruner's reported 23-54% reduction range (arXiv:2601.16746), before that routing decision compounds the saving to 71% off naive. The largest single jump comes last: applying TraceLab's own measured 95.7% prefix cache hit rate, billing most of the carried context at a cache-read rate instead of full input price, takes the same architecture to a 95% reduction. That jump is a direct consequence of how dominant the prefix already is: caching does not shrink what gets read, it changes what a re-read costs, and because re-reads are nearly the entire bill, that lever is disproportionately large. This is the same mechanism this blog covered from a different angle in prompt caching as effectively free money, here quantified against a real coding-agent trace rather than a generic session.
Latency: fewer round trips beats a smaller prefix, alone.
Cost and latency are not reduced by the same lever in the same proportion, because they are driven by different parts of a call.
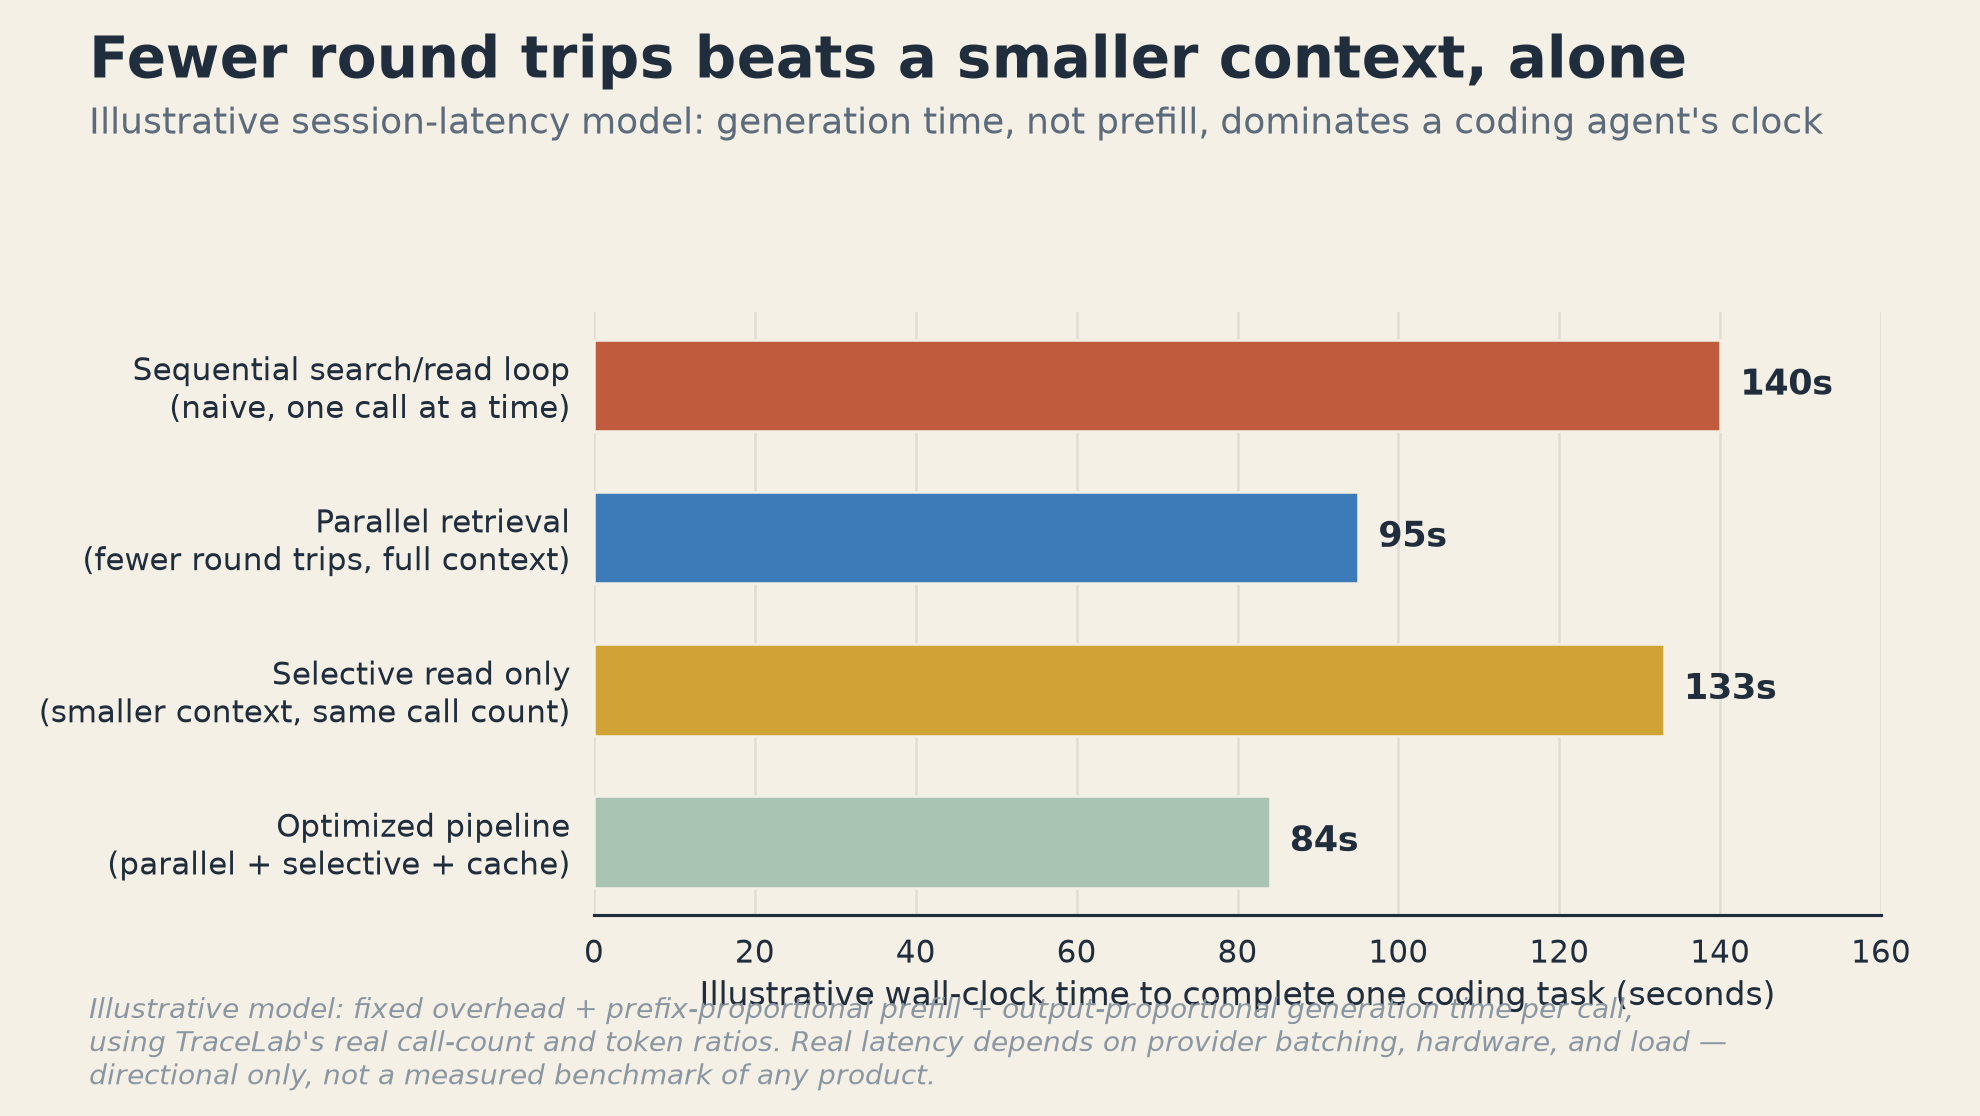
Reducing the prefix alone (selective read) cuts modeled task time by only about 5%, from 140 to 133 seconds, because generation time, driven by output tokens, not prefill time, dominates a coding agent's clock in this model. Batching search and read operations into fewer round trips (parallel retrieval) cuts about 32% on its own, from 140 to 95 seconds, by removing entire round trips rather than shrinking what any one round trip carries. The combined pipeline, parallel calls, a compressed prefix, and cache-accelerated reads, reaches 84 seconds, a 40% reduction. The practical read: a team chasing latency by compressing context alone is optimizing the smaller lever. This is a directional, illustrative model (real latency depends on provider batching, hardware, and load this post does not have access to), but the shape, generation time as the latency floor, matches TraceLab's own finding of long contexts paired with comparatively short outputs.
Where the wasted tokens actually come from.
"Retrieved context" is not one failure mode. Breaking the carried-context overhead down by cause points to different fixes for each slice.
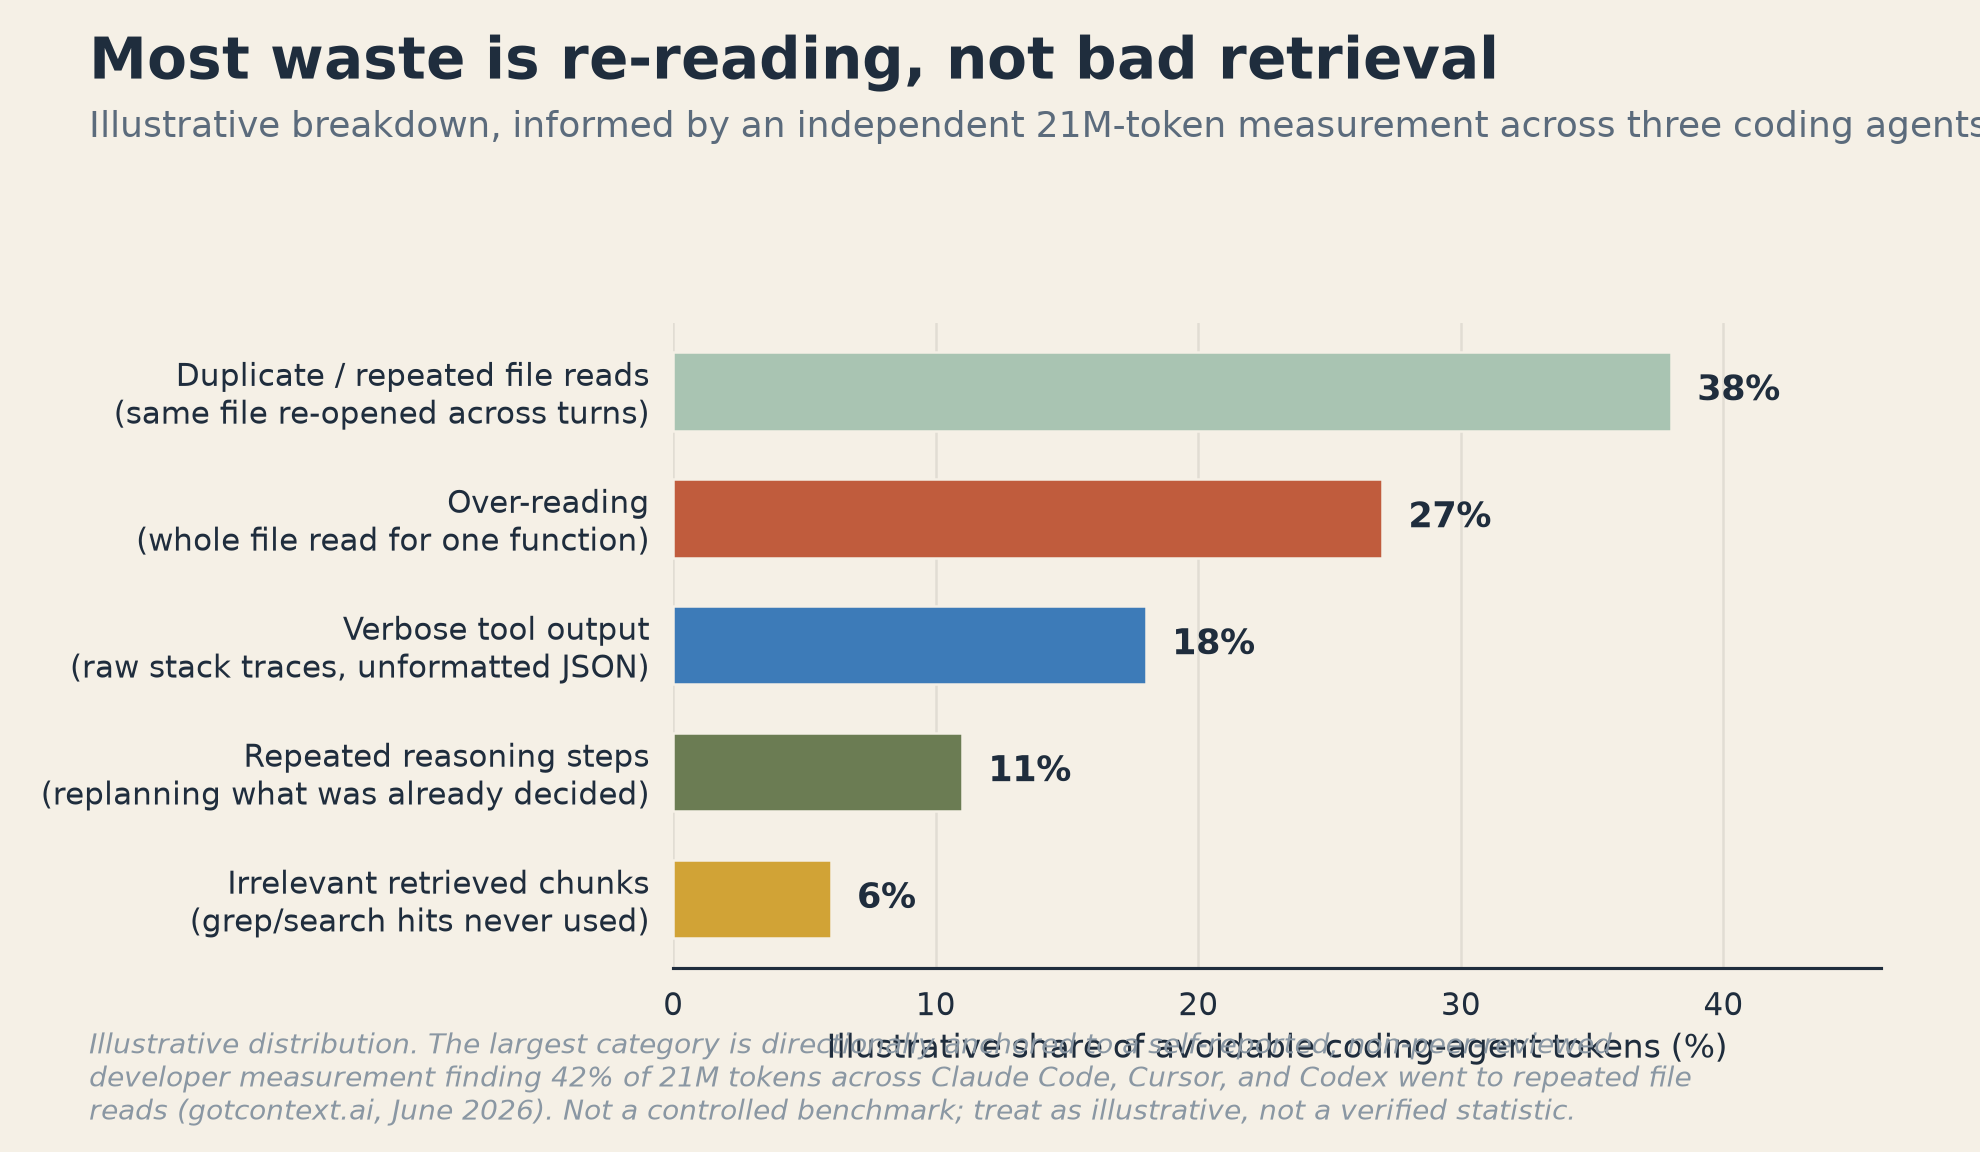
- Duplicate or repeated file reads (38%): the same file re-opened in full on a later turn because the agent's working context no longer holds what it read earlier. An independent, self-reported measurement across roughly 21 million tokens from Claude Code, Cursor, and Codex sessions, published on the r/AI_Agents forum and summarized by gotcontext.ai in June 2026, found 42% of measured tokens went to this kind of avoidable, repeated work. That is a single developer's four-day, non-peer-reviewed measurement, not a controlled study, so treat the exact figure as directional; the category it points at, repeated reads of already-seen files, is the largest slice in the illustrative breakdown above for that reason.
- Over-reading (27%): a whole file pulled into context to answer a question about one function or a handful of lines. Kwon et al., "Coding Agents are Effective Long-Context Processors," arXiv:2603.20432, found that agents using native tools, grep and terminal commands over a codebase treated as a file system, outperformed published state-of-the-art long-context and retrieval baselines by 17.3% on average, which argues that the fix for over-reading is not necessarily less reading but more targeted reading: a line-range or symbol-scoped read instead of a whole-file dump.
- Verbose tool output (18%): raw stack traces, unformatted JSON, and full test-runner logs passed into context unedited.
- Repeated reasoning steps (11%): an agent re-deriving a plan it already committed to earlier in the same session, still present in history and re-read every turn, a pattern this blog examined in more depth in trajectory reduction for ReAct agents.
- Irrelevant retrieved chunks (6%): grep or search hits that never end up used in the eventual fix, the smallest category here because coding agents' own search tools are comparatively precise compared to a general RAG pipeline's retriever, a difference covered from the RAG side in over-retrieval in RAG pipelines.
Cost vs. quality: compression and routing are not interchangeable.
The instinctive response to a high agent bill is to route more aggressively to a cheaper model. The data argues that compression and routing solve different problems and trade off differently against task success.
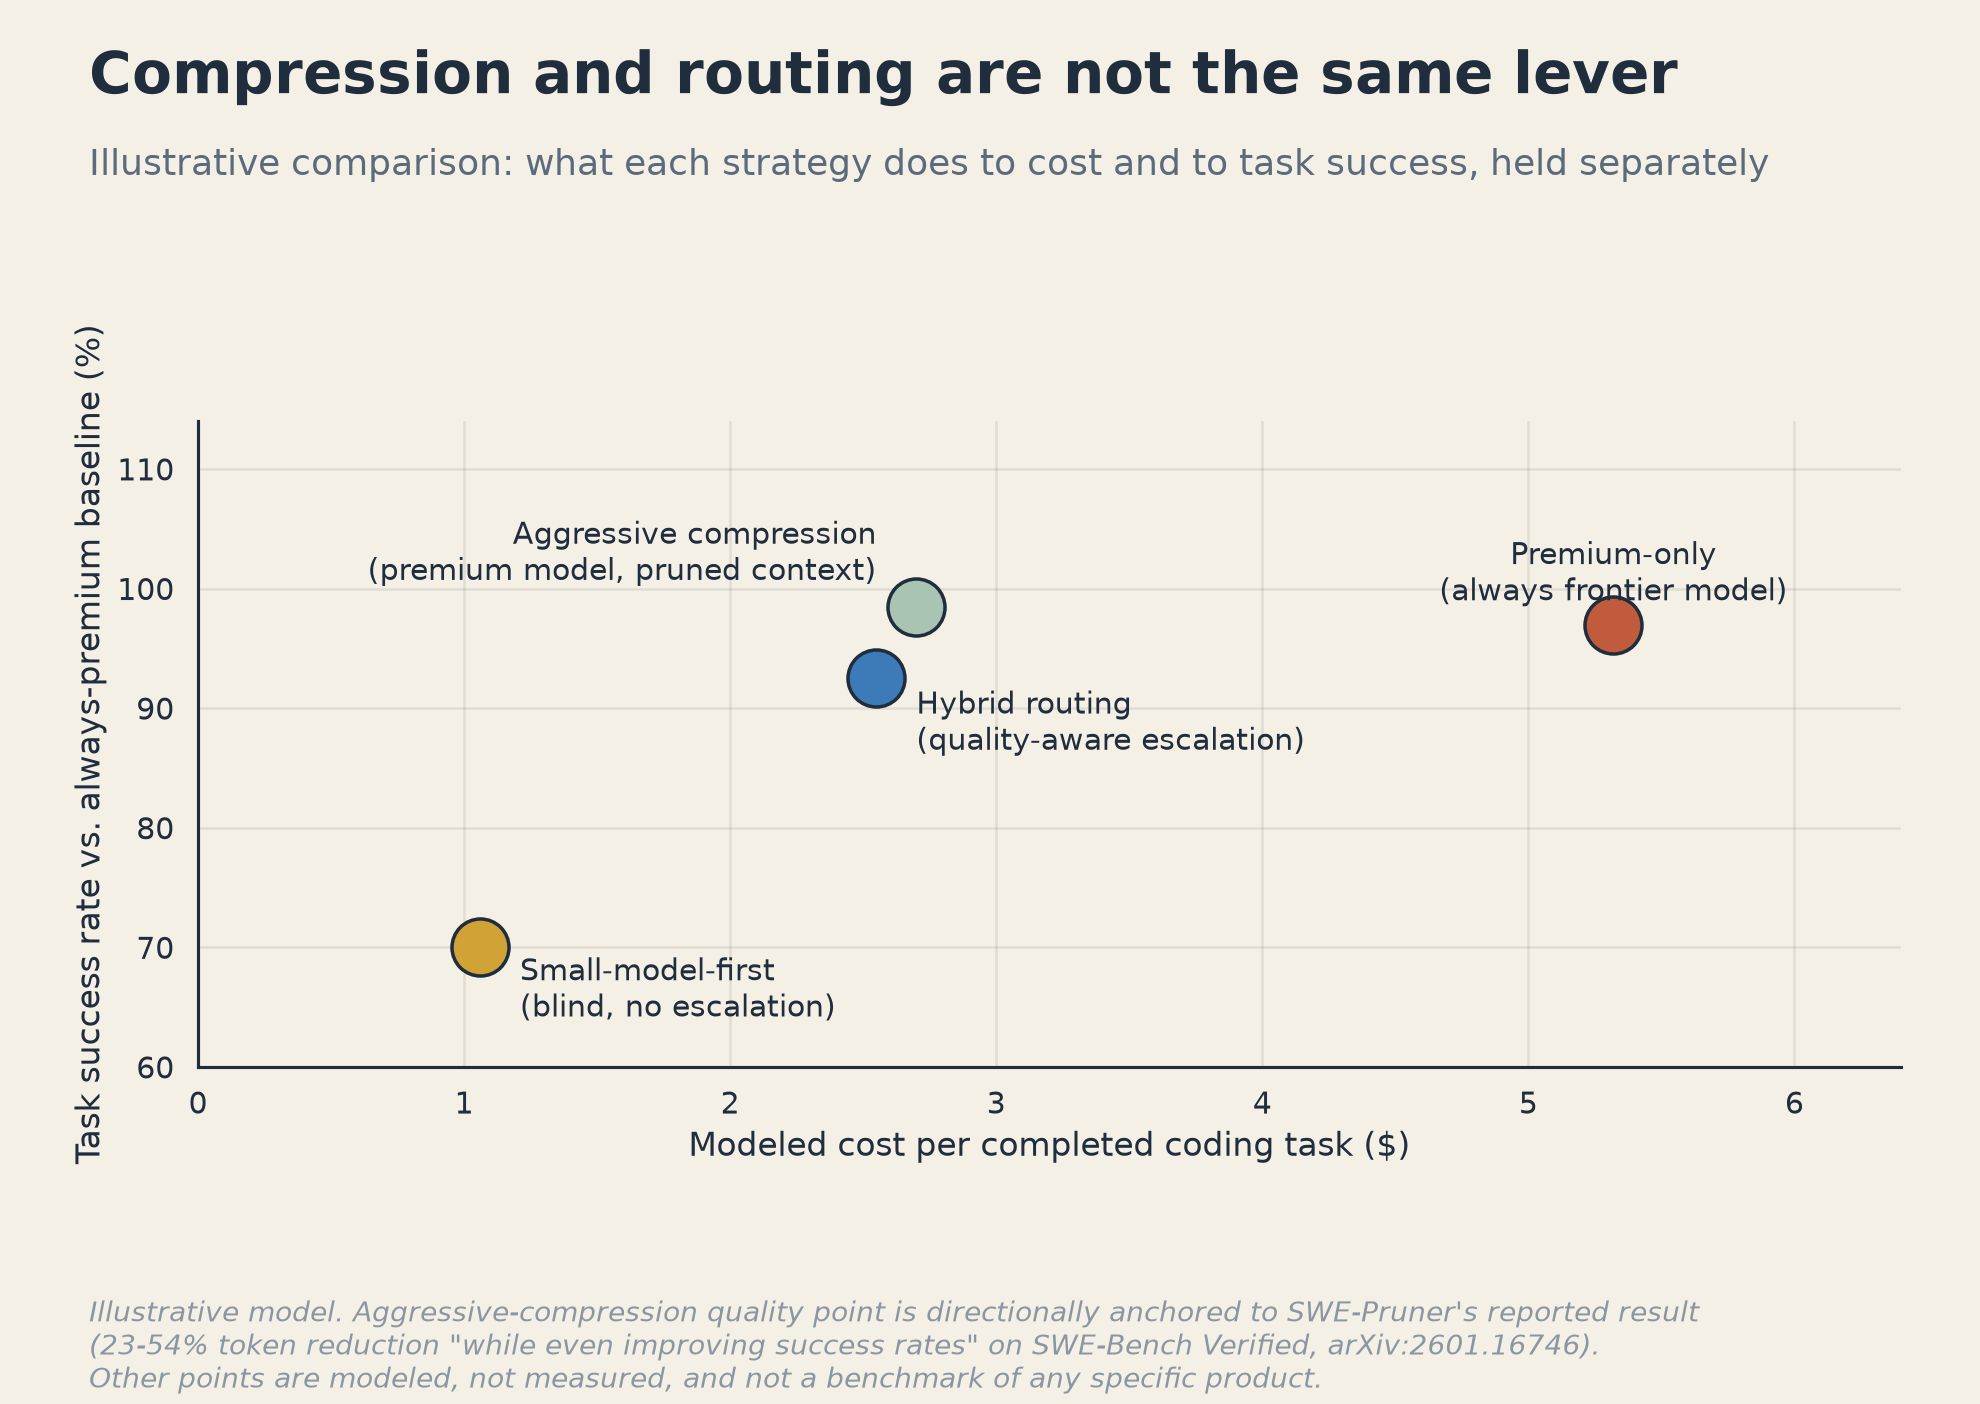
Blind small-model-first cuts cost 80% but drops modeled success rate 27 points, because the weaker model is now doing the actual reasoning and edit generation, not just the mechanical steps, and a lower success rate means more retries, which is its own hidden cost this chart does not even count. Hybrid routing, escalating only the steps that need it, recovers most of the quality at a smaller discount. Aggressive compression, kept on the premium model rather than paired with a downgrade, is the counterintuitive result: it is directionally anchored to SWE-Pruner's own reported finding (arXiv:2601.16746) of 23-54% token reduction on SWE-Bench Verified tasks "while even improving success rates," alongside up to 14.84x compression on single-turn long-context tasks with minimal performance impact. Removing tokens the model was not using to decide its next action does not just fail to hurt quality in that paper's results, it can help, likely by reducing how much irrelevant code the model has to reason past to find what matters. That is a different mechanism from downgrading the model doing the reasoning, and the two get conflated constantly in "just use a cheaper model" advice.
Implementation framework.
Step 1: Instrument token usage by stage. Log prefix, append, and output tokens separately for every call, the same three-way split TraceLab used to characterize its own trace. Most teams have never measured their own prefix-to-append ratio.
import anthropic
client = anthropic.Anthropic()

def call_composition(system: str, history: list, tools: list, model: str) -> dict:
    base = client.messages.count_tokens(model=model, system=system, messages=[]).input_tokens
    full = client.messages.count_tokens(
        model=model, system=system, messages=history, tools=tools
    ).input_tokens
    return {
        "prefix_tokens": full - base,
        "static_overhead": base,
        "total_input": full,
    }
Step 2: Separate reasoning tokens from context tokens. The output split that matters is the model's actual decision (which tool to call, what to write) versus context the call carried along for the ride. TraceLab's ratio shows the second category dominates by roughly two orders of magnitude.
Step 3: Detect over-reading and duplicate retrieval. If a file was already read once this session, re-opening it in full on a later turn instead of referencing what was already extracted is a specific, fixable bug, not an inherent cost of the loop.
Step 4: Route the mechanical steps to a cheaper model. File listing, log parsing, and simple lint-fix generation are classification-grade tasks. They do not need the model doing the task's actual reasoning, and this framework's own data shows blind full-session routing, not selective routing, is what erodes quality.
Step 5: Compress after retrieval, not blindly before. Line-scoped or symbol-scoped reads, and pruning what a read already produced, remove tokens the model demonstrably was not using. Summarizing a file before knowing what the task needs from it risks deleting the part that mattered.
Step 6: Add confidence thresholds and fallback logic. A routing or pruning decision that is wrong on a small share of calls and silently produces a bad edit is worse than a slower path that is consistently correct. Gate aggressive optimization behind a cheap confidence check and fall back to fuller context when it fails.
Step 7: Monitor cost, latency, and success rate together, not cost alone. This model's small-model-first result, cheapest per call and worst on success, is exactly the trap a cost-only dashboard would miss: a cheaper call that has to retry is not actually the cheaper path.
What this means for engineering teams.
TraceLab's 119,000-to-875 ratio is a property of how the coding-agent loop is built, re-sending accumulated context on every call, not a property of any specific task's difficulty. That means no model swap fixes it on its own; it just makes each unit of re-read context cheaper, not smaller. The two-orders-of-magnitude gap between what gets read and what gets newly generated is why caching the prefix, not routing the model, produced the largest single reduction in this post's cost model, and why compressing that same prefix barely moved the latency needle on its own, because latency here is generation-bound, not prefill-bound.
This is the layer model routing needs measurement from, not the layer it replaces. A router with no visibility into prefix-versus-append composition treats every call the same regardless of how much of it is re-read context versus genuinely new work, and a compression step with no routing underneath it still pays a premium-model rate for mechanical steps a small model handles correctly. Nadir is built for the routing half of that combination: classifying each call rather than the whole session and sending mechanical steps to the minimum-cost model that clears a quality floor. When a benchmark is configured and priced, nadir_metadata.benchmark_comparison.savings_usd reports the comparison. Nadir does not decide what an agent reads or how aggressively it compresses context; that is a separate, complementary layer.
Conclusion.
The future of coding-agent cost optimization is not a single number to chase. It is instrumenting what actually gets sent on each call, prefix versus append versus output, before deciding what to cut; caching the carried context because it is nearly the entire bill in a real trace, not because caching is fashionable; compressing what gets retrieved after the read, when the task's requirements are already known, instead of guessing beforehand; and routing the mechanical steps to a cheaper model while measuring success rate alongside cost, because a cheap call that has to retry was never actually cheap. TraceLab's real numbers make the shape of the problem legible for the first time from an actual trace instead of a synthetic benchmark. What a team does with that visibility, cache first, compress deliberately, route selectively, is still the harder part.
Data in charts is illustrative, modeled from published research. Not derived from proprietary production traces. Sources: [Zhu, Jacob, Ma, Pan, Wang, Krishnamurthy, and Kasikci, "TraceLab: Characterizing Coding Agent Workloads for LLM Serving," arXiv:2606.30560 (University of Washington, July 2026)](https://arxiv.org/abs/2606.30560). [Wang, Shi, Yang, Zhang, He, Lian, Chen, Ye, Cai, and Gu, "SWE-Pruner: Self-Adaptive Context Pruning for Coding Agents," arXiv:2601.16746](https://arxiv.org/pdf/2601.16746). [Kwon et al., "Coding Agents are Effective Long-Context Processors," arXiv:2603.20432](https://arxiv.org/abs/2603.20432). [gotcontext.ai, "Researcher finds 42% of coding agent tokens are wasted on repeated file reads," June 2026](https://gotcontext.ai/news/researcher-finds-42-of-coding-agent-tokens-are-wasted-on-repeated-file-reads). Anthropic Claude Pricing, as of August 2026.