TL;DR.
On October 5 the Wall Street Journal put two numbers side by side, and they belong together.
The first is from a survey. Benchmarkit and Mavvrik asked 396 enterprises about their AI spend for the State of AI Cost Governance 2026 report. Only 11% could forecast it within 10%, down from 15% a year earlier. 89% missed by more than that, and 49% had to reprice an AI-powered product because of costs they didn't see coming.
The second is from a paper. Researchers at Stanford, Carnegie Mellon, Berkeley and Microsoft Research ran eight reasoning models on 6,877 tasks and three agentic benchmarks, about 190,000 API calls in all. In The Price Reversal Phenomenon, the model with the lower list price cost more in total in 32% of model pairs. Gemini 3 Flash was listed 80% cheaper than GPT-5.4 and cost 38% more across the tasks.
The second number explains much of the first. Most AI budgets are built as tokens × price per token, and the token count is the part nobody controls. The model decides how long to think.
This post covers what the paper measured, why per-query noise is not your forecasting problem, and a Python harness that prices models the way the paper did: per task, several runs each, on your own prompts. It ends with a forecast you can hand to finance.
Study and survey figures are as published by their authors. Model prices in the tutorial are list prices as of October 6, 2026. The simulation in chart 3 is illustrative, not Nadir customer data.
What the paper measured.
The authors took eight reasoning models at their May 1, 2026 list prices and summed input and output price per million tokens into a single listed price:
| Model | Listed price (input + output, per M) |
|---|---|
| Claude Opus 4.7 | $30.00 |
| GPT-5.4 | $17.50 |
| Gemini 3.1 Pro | $14.00 |
| Claude Haiku 4.5 | $6.00 |
| GPT-5.4 Mini | $5.25 |
| Kimi K2.6 | $4.95 |
| Gemini 3 Flash | $3.50 |
| MiniMax-M2.7 | $1.50 |
Then they ran every model on nine single-turn datasets (math, science, code and QA, 6,877 tasks) and three multi-turn agentic benchmarks, generating 7.39 billion tokens, and compared what each model actually cost. Eight models make 28 pairs per task, 336 pairs in total. In 106 of them the cheaper-listed model was the more expensive one.
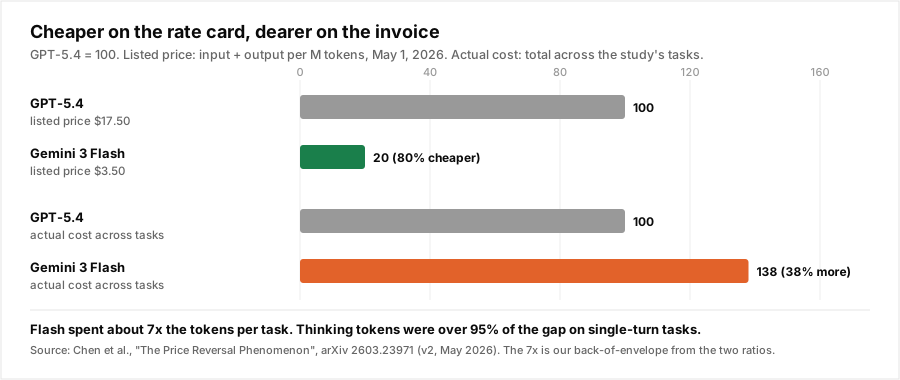
The headline pair is easy to work through. Flash's listed price is 20% of GPT-5.4's. Its actual cost was 138% of GPT-5.4's. For both to be true, Flash had to spend roughly 1.38 / 0.20 ≈ 7x as many tokens on the same work. Our arithmetic, not the paper's, and approximate because input and output tokens are priced differently, but the order of magnitude is right. On one MMLU-Pro question the paper reports Flash using more than 60,000 thinking tokens where GPT-5.4 used 25.
Three findings matter for anyone who owns a bill:
- Thinking tokens drive it. On single-turn tasks, thinking tokens were more than 95% of the cost difference between reversed pairs. On hard tasks, thinking token use differed by up to 900% between models. On the agentic benchmarks the driver was the number of turns. We covered the billing side in extended thinking tokens.
- The same query isn't the same cost twice. Running an identical input on the same model several times produced costs up to 9.7x apart between the cheapest and most expensive run.
- It depends heavily on the task. The reversal rate ranged from 11% on ArenaHard to 57% on MMLU-Pro. The single worst reversal was 28x.
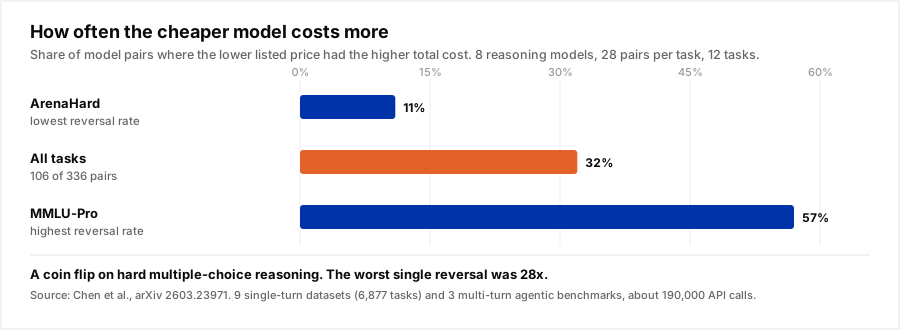
The lead author, Lingjiao Chen, put the conclusion in one line: "Price alone should not be used to infer which model is actually cheaper." The paper leaves predicting per-query cost as an open problem, and argues the run-to-run variance sets a noise floor no predictor can get under.
Why 89% of forecasts miss.
Read the survey and the paper together and the forecasting failure has three layers.
Layer 1: the unit is wrong. A budget built on price per token is a budget built on the one number the paper shows is unreliable. What you pay for is a finished task, and tokens per task vary by model, by task type and by run. If you swapped to a "cheaper" model to save money and the bill went up, this is why.
Layer 2: the mix moves. A team that budgets on GPT-5.4 and later moves half of its traffic to Flash has changed the cost per task without changing a line in the budget. So has a team whose users start asking harder questions, or whose agent gained three new tools. Agents make the mix move faster.
Layer 3: nobody owns the variable. The survey found 62% of organizations had a cost surprise change a business decision in the past year, 40% escalated to the board, 33% froze spending and 25% delayed or cancelled an AI project. Spending freezes are what happens when the only lever left is the cap.
There is one thing the 9.7x does not cause, and it matters for how you fix this.
Noise averages out. Assumptions don't.
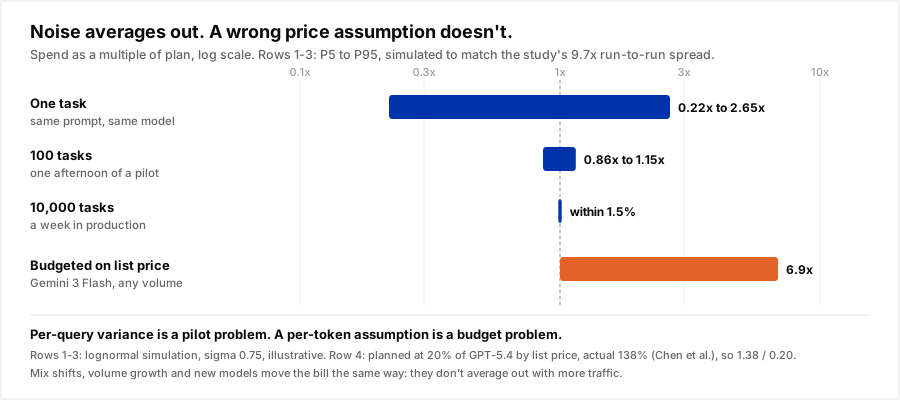
We simulated per-task cost with a spread that reproduces the paper's run-to-run range (a lognormal with σ = 0.75, where the median max-to-min ratio across ten runs comes out at about 9.6x). Then we asked how far the average lands from the true mean:
| Volume | P5 to P95 of actual vs expected |
|---|---|
| 1 task | 0.22x to 2.65x |
| 100 tasks | 0.86x to 1.15x |
| 10,000 tasks | 0.985x to 1.015x |
At production volume, per-query variance disappears into the average. A 9.7x spread on one prompt becomes a 1.5% band on a week of traffic. That's good news for forecasting: the noise floor the paper describes is a problem for a pilot of 50 prompts, not for a monthly budget.
What doesn't average out is a wrong assumption about the mean. If you priced Flash at its list rate relative to GPT-5.4 and it delivered the study's result, your forecast is off by 6.9x at every volume, and more traffic only makes the miss bigger in dollars. The same holds for a mix shift or a new model. So the fix is not a better statistical model of tokens. It's measuring cost per task on your own prompts before you commit, and re-measuring when the mix changes.
Tutorial: measure cost per task, then forecast.
This harness does what the paper did, on your traffic: several runs per prompt per model, priced from the provider's own usage counts, scored for correctness. It needs an OpenAI-compatible endpoint and a sample of 50 to 200 real prompts with a way to check each answer.
Step 1: run each model several times per task.
import itertools, math, random, statistics
from openai import OpenAI

client = OpenAI()  # any OpenAI-compatible endpoint

# USD per million tokens (input, output), October 2026 list prices.
# Reasoning tokens are billed as output. Edit to your contract rates.
PRICES = {
    "gpt-6.1-sol": (2.00, 10.00),
    "sonnet-5.5":  (2.00, 10.00),
    "haiku-4.5":   (1.00, 5.00),
    "gpt-6-luna":  (0.10, 0.50),
}

def run_once(model, prompt):
    r = client.chat.completions.create(
        model=model, messages=[{"role": "user", "content": prompt}]
    )
    u = r.usage
    details = getattr(u, "completion_tokens_details", None)
    reasoning = (getattr(details, "reasoning_tokens", 0) or 0) if details else 0
    pin, pout = PRICES[model]
    # completion_tokens already includes reasoning tokens on OpenAI-style usage
    usd = (u.prompt_tokens * pin + u.completion_tokens * pout) / 1e6
    return usd, reasoning, r.choices[0].message.content

def measure(models, tasks, runs=5):
    """tasks: list of {"id": str, "prompt": str, "check": callable(answer) -> bool}"""
    rows = []
    for t, m in itertools.product(tasks, models):
        for k in range(runs):
            usd, reasoning, answer = run_once(m, t["prompt"])
            rows.append({"task": t["id"], "model": m, "run": k, "usd": usd,
                         "reasoning": reasoning, "ok": bool(t["check"](answer))})
    return rows
Five runs per prompt is the minimum to see the spread. With 100 prompts and four models that's 2,000 calls, a few dollars on most rate cards.
Step 2: rank by cost per solved task, not by list price.
def report(rows):
    out = {}
    for m in {r["model"] for r in rows}:
        mr = [r for r in rows if r["model"] == m]
        costs = sorted(r["usd"] for r in mr)
        solved = sum(r["ok"] for r in mr)
        by_task = {}
        for r in mr:
            by_task.setdefault(r["task"], []).append(r["usd"])
        spreads = [max(c) / min(c) for c in by_task.values() if min(c) > 0]
        out[m] = {
            "listed": sum(PRICES[m]),                      # the paper's input + output
            "mean_per_task": statistics.fmean(costs),
            "p90_per_task": costs[int(0.9 * (len(costs) - 1))],
            "pass_rate": solved / len(mr),
            "per_solved": sum(costs) / max(solved, 1),
            "median_run_spread": statistics.median(spreads) if spreads else float("nan"),
            "mean_reasoning": statistics.fmean(r["reasoning"] for r in mr),
        }
    return out

def reversals(stats):
    """Pairs where the lower listed price has the higher mean cost per task."""
    found = []
    for a, b in itertools.combinations(stats, 2):
        lo, hi = sorted((a, b), key=lambda m: stats[m]["listed"])
        if stats[lo]["listed"] < stats[hi]["listed"] and \
           stats[lo]["mean_per_task"] > stats[hi]["mean_per_task"]:
            found.append((lo, hi, stats[lo]["mean_per_task"] / stats[hi]["mean_per_task"]))
    return found

stats = report(rows)
for m, s in sorted(stats.items(), key=lambda kv: kv[1]["per_solved"]):
    print(f"{m:12} listed ${s['listed']:>6.2f}  per task ${s['mean_per_task']:.5f}  "
          f"p90 ${s['p90_per_task']:.5f}  pass {s['pass_rate']:.0%}  "
          f"per solved ${s['per_solved']:.5f}  run spread {s['median_run_spread']:.1f}x")
for lo, hi, x in reversals(stats):
    print(f"REVERSAL: {lo} is listed cheaper than {hi} but costs {x:.2f}x per task")
Sort by cost per solved task. A model that's cheap per call and fails a third of the time is not cheap: every failure is paid for once on the cheap model and again on whatever handles the retry. That's the retry tax, and it's the agentic version of the paper's reversal.
Step 3: forecast the bill with a range, not a point.
def forecast(stats, plan, volume_low, volume_high, fallback=None, sims=5000):
    """plan: {model: share of traffic}. fallback: model that retries failures."""
    bills = []
    for _ in range(sims):
        volume = random.uniform(volume_low, volume_high)
        bill = 0.0
        for m, share in plan.items():
            s, n = stats[m], volume * share
            per_task = s["mean_per_task"]
            if fallback and m != fallback:
                per_task += (1 - s["pass_rate"]) * stats[fallback]["mean_per_task"]
            # sum of n noisy tasks: the mean is stable, the volume isn't
            sd = (s["p90_per_task"] - s["mean_per_task"]) / 1.28
            bill += random.gauss(per_task * n, max(sd, 0) * math.sqrt(n))
        bills.append(bill)
    bills.sort()
    return {p: bills[int(p / 100 * (sims - 1))] for p in (10, 50, 90)}

print(forecast(stats, {"haiku-4.5": 0.8, "sonnet-5.5": 0.2},
               volume_low=400_000, volume_high=600_000, fallback="sonnet-5.5"))
Give finance the P10, P50 and P90, and say which assumptions they depend on: the volume range, the traffic mix, and the pass rate that decides how often you pay the fallback. When you run it you'll see what chart 3 shows. The band comes almost entirely from volume and mix, not from per-query noise.
Step 4: re-measure when anything changes.
The forecast is only as good as the last measurement. Re-run steps 1 and 2 when a provider ships a new model version, when you change reasoning effort or thinking budgets, when a prompt template changes, and monthly regardless. Capping reasoning is the most direct lever on the paper's main driver: a max_tokens ceiling or a low effort setting bounds the 60,000-token tail, at some cost in pass rate that step 2 will show you.
Where Nadir fits.
The harness above answers "which model is cheapest per solved task" once, for a sample. Production traffic asks it again on every request, because the answer depends on the prompt. That's the decision Nadir makes. Send model="auto" and a trained classifier picks a tier per prompt against the quality floor you set on the API key. Each response carries the routing decision and its cost in the metadata, so actual cost per task is a number you read, not one you estimate. If you only want the decision, POST /v1/bucket returns simple, medium or complex with a probability for each, and you call your own providers.
For forecasting, start in observe mode. It records what routing would have chosen on your real traffic without changing a single response, and that gives you a measured mix and cost per request to feed step 3. Start with a free key, or read how per-team attribution turns the same data into chargeback.
Conclusion.
Only 11% of enterprises can forecast AI spend within 10%, and a study of 190,000 API calls shows why the usual method fails: in 32% of model pairs the cheaper-listed reasoning model cost more, because it spent more tokens thinking. Price per token is the wrong unit. The good news is in the statistics. Per-query variance of 9.7x shrinks to about 1.5% over 10,000 tasks, so the noise is not what breaks forecasts. Wrong assumptions about the mean are, and those you can measure. Price models per solved task on your own prompts, forecast with a range driven by volume and mix, and re-measure when the mix moves.
Sources: Lingjiao Chen et al., ["The Price Reversal Phenomenon"](https://arxiv.org/html/2603.23971v2), arXiv 2603.23971, v2 May 28, 2026. [The Wall Street Journal](https://www.wsj.com/tech/personal-tech/ai-token-spending-businesses-431ee94a), October 5, 2026, as summarized by [PYMNTS](https://www.pymnts.com/news/artificial-intelligence/2026/businesses-finding-it-harder-to-predict-ai-spending/) and [Implicator](https://www.implicator.ai/cheaper-ai-models-cost-more-price-reversal-study/). Benchmarkit and Mavvrik, [State of AI Cost Governance 2026](https://www.mavvrik.ai/blog/blog-ai-cost-governance-report-2026/) (396 enterprises, April to May 2026), with the escalation, freeze and repricing figures via [Channel Insider](https://www.channelinsider.com/ai/mavvrik-state-of-ai-cost-governance/). Chart 3 rows 1 to 3 are a lognormal simulation (σ = 0.75) calibrated to the paper's 9.7x run-to-run spread. Tutorial prices are list prices as of October 6, 2026.