TL;DR.
Two things went around this week, and they seem to contradict each other.
The first is an essay. The essay "Tokens too cheap to meter" on jyn.dev reached 354 points and 227 comments on Hacker News. Its argument: the price of machine intelligence is falling by orders of magnitude a year, and an LLM call will soon cost less than running grep. Quality and access will limit AI use, not the token count.
The second is a survey. Accenture Research's CIO's Guide to AI Tokenomics, reported on October 4, asked 750 executives at companies with more than $1 billion in revenue about their token spend. One in three had already used up their annual token budget. They expect consumption to grow 78% over the next 24 months while price per token falls 19%, so their bill rises about 44%.
Both are right. The essay describes the price floor: the cheapest model on the list. The survey describes the mix: what companies actually send to which model. The two numbers that connect them are in the same Accenture report:
- 54% of AI requests go to a needlessly expensive model tier.
- Under 10% of occupational tasks need frontier capability, and frontier models cost 10 to 20x mid-tier ones.
This post reproduces the grep math, prices one agent turn across the October 2026 ladder, works through Accenture's arithmetic, and ends with a Python script that measures your own tier mismatch from a request log in an afternoon.
Survey figures are Accenture's as reported in the press. Model prices are list prices as of October 5, 2026. The scenarios are illustrative, not Nadir customer data.
The grep math, reproduced.
The essay's comparison is worth doing yourself, because the method is the useful part.
One model turn. A coding agent's tool call carries roughly 10,000 tokens of context. At the essay's figure of about $0.30 per million tokens for a small model, that's about $0.003 a turn, a third of a cent.
One grep. A laptop draws around 10 W. A grep over a project takes about 0.1 s. That's 1 joule, or 0.00000028 kWh. At $0.25 per kWh, a grep costs about $0.00000007.
The ratio is roughly 43,000x, or 4.6 orders of magnitude, which matches the essay's "4.5 orders." If prices keep falling at the 2.5 orders a year the essay cites, the gap closes within two years. That's the argument, and the arithmetic holds.
Here's what it leaves out. The cheap model in that calculation isn't the model most companies use.
The same turn, priced across the ladder.
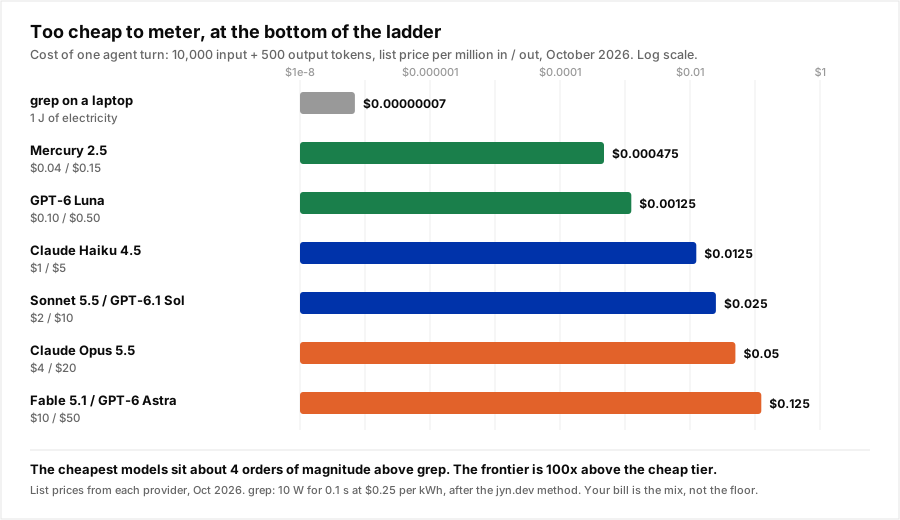
Same turn, 10,000 tokens in and 500 out, at list prices:
| Model | Input / output, per M | Per turn | Per million turns | vs GPT-6 Luna |
|---|---|---|---|---|
| Mercury 2.5 (diffusion) | $0.04 / $0.15 | $0.000475 | $475 | 0.4x |
| GPT-6 Luna | $0.10 / $0.50 | $0.00125 | $1,250 | 1x |
| Claude Haiku 4.5 | $1 / $5 | $0.0125 | $12,500 | 10x |
| Claude Sonnet 5.5, GPT-6.1 Sol | $2 / $10 | $0.025 | $25,000 | 20x |
| Claude Opus 5.5 | $4 / $20 | $0.05 | $50,000 | 40x |
| Fable 5.1, GPT-6 Astra | $10 / $50 | $0.125 | $125,000 | 100x |
Sources: Mercury 2.5 on OpenRouter, GPT-6 Sol and Luna, Sonnet 5.5 vs GPT-6.1 Sol. No caching, no batch discount.
The bottom of the ladder is close to free. A million agent turns on Luna costs $1,250. The top of the ladder costs 100x that for the same tokens. "Too cheap to meter" is true of the bottom rung. Most enterprise traffic doesn't run on the bottom rung.
Prices also fall at different rates across the ladder. BenchLM's frontier index, which tracks the top models, sat at $2.13 per million blended tokens on October 2, down 9.1% in a month and up 80.8% in a year. New frontier models launch at the top, and the top is where the default traffic goes. We covered that split in frontier pricing up, mid-tier down.
Accenture's arithmetic.
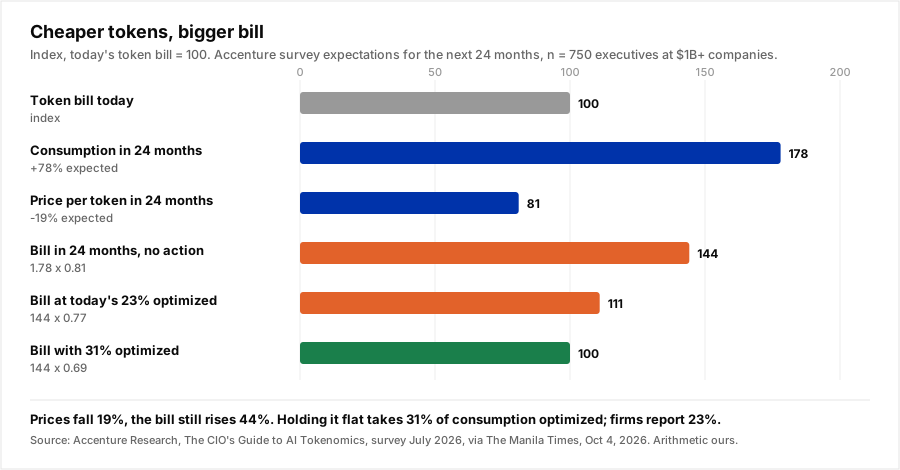
The survey's core numbers fit in three lines:
bill in 24 months = consumption x price = 1.78 x 0.81 = 1.44
to stay flat, optimize = 1 - 1 / 1.44 = 31% of consumption
optimized today = 23%
The respondents spent about $2.5 billion on tokens last year and project $3.6 billion within 24 months without intervention. That's the 44% increase, and a 19% fall in price per token doesn't touch it. It's the Jevons pattern in one survey: cheaper tokens get used more, and agents use them far faster than chat did. As one executive put it to Accenture: "Even if models become cheaper, teams just use them more."
Two other findings matter for what you do next:
- Only 20% of token spend is tied to a quantified financial outcome. Companies that run chargeback and measure each workload get that to 32 cents per dollar. If you can't say which team spent the tokens, start with per-team attribution.
- CFOs want visibility more than discounts. A Fortune 500 AI strategy director framed the question as "what that token actually did," not how many were consumed.
And the line that matters most: 54% of requests are routed to an unnecessarily expensive tier. Accenture's illustration was blunter: "Your Toyota Camry will do just fine. You don't need to upgrade to a Ferrari."
The bill is the mix.
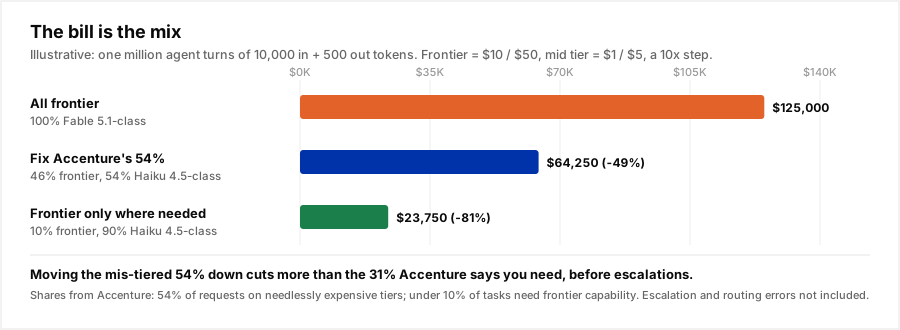
Put Accenture's shares on the price ladder. Take a workload of one million agent turns, all on a frontier model at $10 / $50, with a mid tier at $1 / $5, the 10x step at the low end of Accenture's 10 to 20x range:
| Scenario | Frontier share | Mid-tier share | Cost | Change |
|---|---|---|---|---|
| Everything on the frontier | 100% | 0% | $125,000 | |
| Move Accenture's 54% down | 46% | 54% | $64,250 | −49% |
| Frontier only where needed | 10% | 90% | $23,750 | −81% |
The first fix alone cuts more than the 31% Accenture says is needed to hold spending flat. No cheaper tokens, no fewer tasks, only a different model per request.
The ceiling has to be read honestly. These numbers assume you know which 54% are mis-tiered, and you don't, not in advance. A router that sends a hard prompt to a small model pays for it twice: once for the failed answer, again for the retry on the big one. We worked through that in the retry tax, and the published benchmarks show most routers don't beat a well-chosen single model. The gap between 49% on paper and what you actually keep is decided by routing accuracy and how you handle the misses.
Tutorial: measure your tier mismatch in an afternoon.
You don't need a router to find out whether you have Accenture's problem. You need a request log and a price table. This script answers three questions: where the money goes by model, how much of the frontier spend is on short, simple-looking requests, and what that spend would cost one tier down.
Step 1: export a log.
Most gateways and observability tools can export one row per request. You need four columns: model, input_tokens, output_tokens, and the prompt text or a label for it. A week of production traffic is enough.
Step 2: price it and find the concentration.
import pandas as pd

# USD per million tokens, October 2026 list prices. Edit to your contracts.
PRICES = {
    "fable-5.1":     (10.00, 50.00),
    "gpt-6-astra":   (10.00, 50.00),
    "opus-5.5":      (4.00, 20.00),
    "sonnet-5.5":    (2.00, 10.00),
    "gpt-6.1-sol":   (2.00, 10.00),
    "haiku-4.5":     (1.00, 5.00),
    "gpt-6-luna":    (0.10, 0.50),
}
FRONTIER = {"fable-5.1", "gpt-6-astra", "opus-5.5"}
STEP_DOWN = {"fable-5.1": "sonnet-5.5", "gpt-6-astra": "gpt-6.1-sol", "opus-5.5": "haiku-4.5"}

def cost(model, tin, tout):
    pin, pout = PRICES[model]
    return (tin * pin + tout * pout) / 1e6

df = pd.read_csv("requests.csv")          # model, input_tokens, output_tokens, prompt
df["usd"] = [cost(m, i, o) for m, i, o in zip(df.model, df.input_tokens, df.output_tokens)]

by_model = df.groupby("model")["usd"].agg(["count", "sum"]).sort_values("sum", ascending=False)
by_model["share_of_spend"] = by_model["sum"] / df.usd.sum()
print(by_model)
What you're looking for is concentration: one or two frontier models carrying most of the spend on a minority of the requests.
Step 3: flag the requests that probably didn't need the frontier.
A crude first pass is enough to size the problem. Short outputs, short prompts and no reasoning-heavy keywords are weak signals of a simple request. They're wrong often, so treat the result as a range, not a verdict.
HARD_WORDS = ("prove", "debug", "refactor", "architecture", "why does", "race condition", "optimize")

def looks_simple(row):
    p = str(row.prompt).lower()
    return (
        row.output_tokens < 400
        and len(p) < 2_000
        and not any(w in p for w in HARD_WORDS)
    )

frontier = df[df.model.isin(FRONTIER)].copy()
frontier["simple"] = frontier.apply(looks_simple, axis=1)
frontier["usd_down"] = [
    cost(STEP_DOWN[m], i, o) if s else u
    for m, i, o, s, u in zip(frontier.model, frontier.input_tokens,
                             frontier.output_tokens, frontier.simple, frontier.usd)
]

share = frontier.simple.mean()
saved = frontier.usd.sum() - frontier.usd_down.sum()
print(f"frontier requests flagged simple: {share:.0%}  (Accenture's average: 54%)")
print(f"frontier spend: ${frontier.usd.sum():,.2f}  ->  ${frontier.usd_down.sum():,.2f}")
print(f"upper bound on saving: ${saved:,.2f} ({saved / df.usd.sum():.0%} of total spend)")
Step 4: replace the heuristic before you trust the number.
Keyword rules are how you size the opportunity, not how you capture it. To get a defensible number, label a few hundred of the flagged requests: run each on the cheaper model and have a reviewer or a strong judge model mark whether the answer was acceptable. The share that passes is your real mismatch rate, and the share that fails is your escalation rate. Multiply the failures by the cost of a retry and subtract that from the saving. What's left is what routing is worth on your traffic. We wrote up the full method, with thresholds, in the confidence threshold sweep.
Where Nadir fits.
Step 4 is the hard part, and it's what Nadir does on every request. Send model="auto" and a trained classifier picks a tier per prompt, against the quality floor you set on the API key, with the decision and its cost in the response metadata. If you only want the decision, POST /v1/bucket returns simple, medium or complex with a probability for each, and you keep calling your own providers.
To find out whether you have the 54% problem before changing anything, start in observe mode. It records what routing would have chosen without changing a single response, so you can size the saving on your own traffic first. That's the number a CFO is asking for: what each token did, and what it should have cost. Start with a free key.
Conclusion.
"Too cheap to meter" is true at the bottom of the price ladder. A 10,000-token agent turn on GPT-6 Luna costs $0.00125, about four orders of magnitude above a grep and falling. It's not true of enterprise bills, because enterprise traffic isn't at the bottom. Accenture's respondents expect a 44% increase over two years even as token prices fall 19%, a third of them ran out of budget early, and by their own estimate more than half their requests go to a tier they didn't need. On a 10x price step, fixing that mix cuts more than they need to hold spending flat. Cheap tokens don't fix a budget on their own. Sending each request to the cheapest model that can handle it does. Measure your mismatch first, then route.
Sources: [jyn.dev, "Tokens too cheap to meter"](https://jyn.dev/tokens-too-cheap-to-meter/), September 2026, and the [Hacker News discussion](https://news.ycombinator.com/item?id=49813482). [The Manila Times, "AI token costs emerge as enterprise risk"](https://manilatimes.net/2026/10/04/business/sunday-business-it/ai-token-costs-emerge-as-enterprise-risk/2438338), October 4, 2026, reporting Accenture Research's "The CIO's Guide to AI Tokenomics" (survey of 750 executives at $1B+ companies in 17 countries, July 2026). [Token Cost Radar, October 3, 2026](https://jcodemunch.com/radar/2026-10-03), citing BenchLM's frontier token price index. [Mercury 2.5 pricing on OpenRouter](https://openrouter.ai/inception/mercury-2.5). Other model prices from each provider's list price as of October 5, 2026. The grep energy estimate follows the essay's method with a $0.25 per kWh electricity rate.