TL;DR.
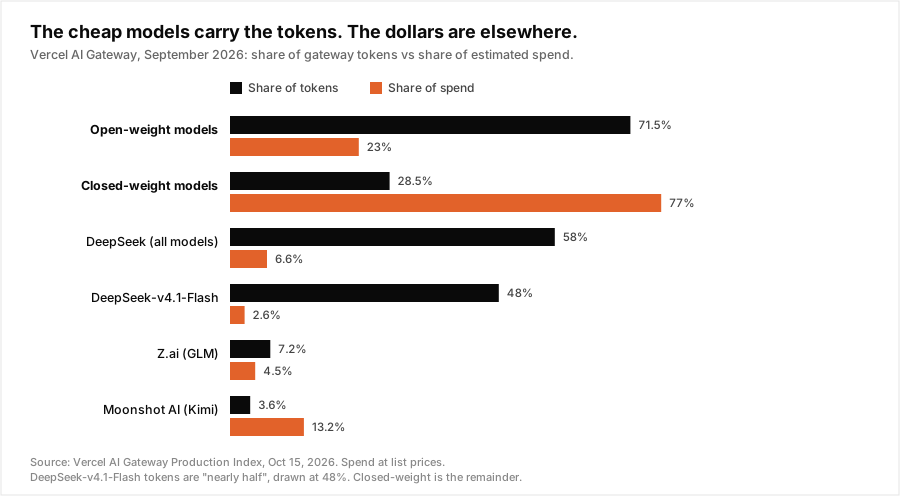
On October 15, Vercel published its October AI Gateway Production Index, a read of anonymized production traffic through September 2026. The headline: open-weight models processed 71.5% of gateway tokens and took about 23% of spend.
That one split says a lot about how production teams buy inference now:
- The cheap models carry the volume. DeepSeek-v4.1-Flash alone processed nearly half of all September tokens for 2.6% of spend.
- The dollars stay with the frontier. Closed-weight models are under 30% of tokens and about 77% of spend.
- It's additive, not a swap. 68% of teams that spent more on open-weight models also spent more on closed-weight ones. Total gateway spend was about 13x December's, while the average price per token fell 47%.
- Nobody sits still. In September nearly 1 in 2 teams changed their most-used model, and almost 1 in 3 changed their most-used lab, an index record. Teams at a billion tokens used 42 models on average.
The production market is already routing. Most of it is doing it by hand, with model strings in config files that change every month. This post covers what the index shows, what it doesn't, and a Python tutorial that computes your own token-vs-spend split from a usage export, finds the premium dollars sitting on simple tasks, and prices the move before you make it.
Gateway figures are Vercel's, from the October 2026 index, with spend estimated at list prices. The tutorial runs on a synthetic log with illustrative prices, labeled where it appears. Nothing here is Nadir customer data.
The split.
| September 2026 | Share of tokens | Share of spend |
|---|---|---|
| Open-weight models | 71.5% | ~23% |
| Closed-weight models | ~28.5% | ~77% |
| DeepSeek (all models) | 58% | 6.6% |
| DeepSeek-v4.1-Flash | nearly half | 2.6% |
| Z.ai (GLM) | 7.2% | 4.5% |
| Moonshot AI (Kimi) | 3.6% | 13.2% |
Two things stand out.
"Open-weight" is not one price. DeepSeek and Kimi are both open-weight, and they sit at opposite ends of the chart. DeepSeek carries 58% of tokens for 6.6% of spend. Kimi carries 3.6% of tokens for 13.2% of spend, and Vercel says Kimi K3 accounted for nearly half of the September increase in open-weight spend. The useful line isn't open versus closed. It's cheap-tier versus premium-tier, and both camps now have models on each side.
Spend share moved fast. Open-weight took about 1 in 20 gateway dollars in June and nearly 1 in 4 in September, the largest monthly gains in both token share and spend share in the index's history. In August, open-weight models processed the majority of gateway tokens for the first time.
What the split doesn't say.
It doesn't say open-weight models are replacing frontier models. Vercel's own numbers argue the opposite:
- Frontier-model spend grew about 10x since December. Open-weight spend grew more than 70x, from a much smaller base.
- 68% of teams that increased open-weight spending also increased closed-weight spending.
- Claude Opus 5.5 took 11.03% of September spend share, the largest of any launch that month, and almost nine in ten of its dollars came from teams already on Opus 5.
So the picture is a two-tier stack: cheap models absorb the volume while premium models keep the hard work and most of the budget. It matches what we called the two-speed market in pricing, now visible in production traffic.
It also doesn't say the bill went down. Gateway spend was about 13x December's while the average price per token fell 47%, and the median paid customer active in both months more than doubled its spend. Cheaper tokens bought more tokens, the same pattern behind cheaper tokens making the routing case stronger.
And the spend figures are estimated at published list prices. Batch discounts, cache pricing, committed-use deals, and BYOK arrangements aren't in them, and Vercel notes prior months may be revised. It's a large, real sample of production traffic through one gateway, not a census of the market.
Forty-two models and a moving target.
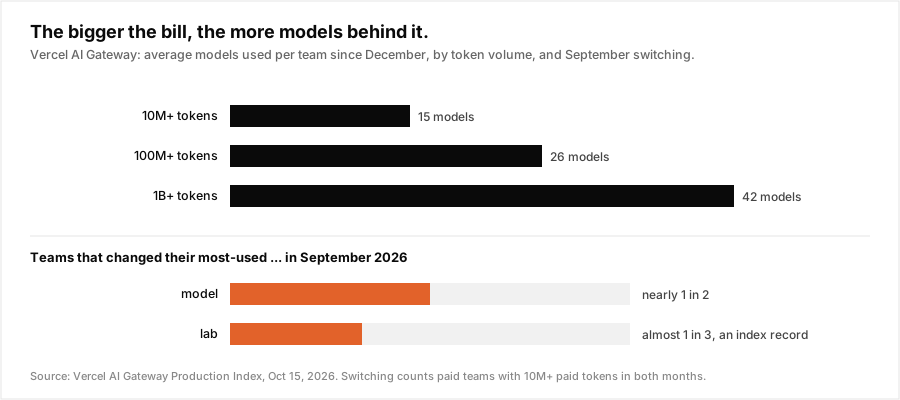
Teams that processed at least 10 million tokens since December used an average of 15 models. At 100 million tokens it's 26. At a billion it's 42. Model and lab switching rose for the fifth consecutive month in September.
The launch data shows how quickly the menu changes. Jev reached 35% of paid teams in its first 14 days, the fastest adoption in the index's history. GPT-6 Luna reached about 14.9% of teams with the highest return rate of the month, 64.8%. Anthropic's spend share fell from 63.7% to 43.9% in one month, with Opus accounting for 17 of the roughly 20 points lost.
Vercel's own line sums it up: "The model is becoming a replaceable part of a much larger investment."
For an engineering team that's a maintenance problem as much as a pricing one. If one in three teams changes its main lab in a given month, then every hard-coded model="..." string is a decision someone has to revisit, test, and redeploy. Do that across 42 models and the routing logic ends up spread through feature flags, config files, and code review threads, with no single place that knows what a task costs or which model last passed its eval.
Tutorial: compute your own split.
The index tells you what the gateway's traffic looks like on average. The question that matters is what yours looks like. You need one export: a row per request with the model, input tokens, cached input tokens, and output tokens. Every major provider and gateway gives you these fields, and a task label (from your route name, prompt template, or feature flag) makes it much more useful.
Step 1: price every request.
Use your actual rate card. The prices below are illustrative, per million tokens. Check each provider's pricing page before you trust a number.
from collections import defaultdict

# Illustrative list prices, $ per 1M tokens: (input, cached input, output).
PRICES = {
    "claude-opus-5.5":     (4.00, 0.40, 20.00),
    "claude-sonnet-5.5":   (2.00, 0.10, 10.00),
    "kimi-k3":             (3.00, 0.30, 15.00),
    "gpt-6-luna":          (0.10, 0.01, 0.50),
    "claude-haiku-5.5":    (0.10, 0.01, 0.50),
    "deepseek-v4.1-flash": (0.15, 0.003, 0.60),
}
CHEAP = {"gpt-6-luna", "claude-haiku-5.5", "deepseek-v4.1-flash"}

def cost(r):
    pin, pcache, pout = PRICES[r["model"]]
    fresh = r["input_tokens"] - r["cached_tokens"]
    return (fresh * pin + r["cached_tokens"] * pcache
            + r["output_tokens"] * pout) / 1e6
Step 2: token share vs spend share.
def split(rows, key):
    tok, usd = defaultdict(int), defaultdict(float)
    for r in rows:
        tok[r[key]] += r["input_tokens"] + r["output_tokens"]
        usd[r[key]] += cost(r)
    T, D = sum(tok.values()), sum(usd.values())
    print(f"{key:<22}{'tokens':>9}{'spend':>9}{'$/1M':>8}")
    for k in sorted(usd, key=usd.get, reverse=True):
        print(f"{k:<22}{tok[k]/T:>8.1%}{usd[k]/D:>9.1%}"
              f"{usd[k]/tok[k]*1e6:>8.2f}")
    return D

rows = load_usage_export()   # list of dicts: task, model, token counts
total = split(rows, "model")
We ran it on a synthetic month for one team: 200,000 requests and 2.4 billion tokens across five task types (classify, extract, summarize, chat, and agent steps) and six models. The generator is deliberately ordinary. Most simple tasks already go to a cheap model, but a share of them still default to Sonnet or Opus, the way they do when a model string was set once and never revisited.
model                    tokens    spend    $/1M
claude-opus-5.5          36.2%    48.6%    1.94
claude-sonnet-5.5        34.0%    31.6%    1.34
kimi-k3                  16.4%    18.7%    1.65
deepseek-v4.1-flash       3.8%     0.4%    0.17
claude-haiku-5.5          6.3%     0.4%    0.10
gpt-6-luna                3.3%     0.3%    0.11
total                    2.40B $   3,470

cheap tier: 13.4% of tokens, 1.1% of spend
Vercel open-weight, Sep 2026: 71.5% of tokens, 23% of spend
This team's cheap tier carries 13.4% of tokens. The gateway average for open-weight is 71.5%. That gap is not automatically a problem, because it depends entirely on what the traffic is. So break it down by task.
Step 3: where do the premium dollars go?
by_task = defaultdict(float)
for r in rows:
    if r["model"] not in CHEAP:
        by_task[r["task"]] += cost(r)
for t, d in sorted(by_task.items(), key=lambda x: -x[1]):
    print(f"  {t:<10} ${d:>8,.0f}  {d/total:>6.1%} of the bill")
premium spend by task (models outside the cheap tier)
agent $ 2,518 72.6% of the bill
summarize $ 475 13.7% of the bill
extract $ 207 6.0% of the bill
chat $ 179 5.2% of the bill
classify $ 53 1.5% of the bill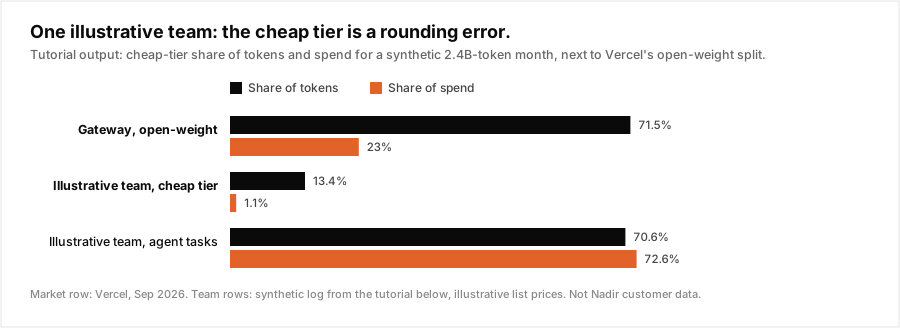
Agent tasks are 15% of this team's requests, 70.6% of its tokens, and 72.6% of its bill. The cheap tier looks small mostly because the agent loop is huge, not because simple tasks are badly placed. That's worth knowing before anyone rewrites a config file.
Step 4: price the move, and label it an upper bound.
target = {"classify": "deepseek-v4.1-flash",
          "extract": "gpt-6-luna",
          "summarize": "claude-haiku-5.5"}

def what_if(rows, target):
    new = 0.0
    for r in rows:
        if r["task"] in target and r["model"] not in CHEAP:
            r = dict(r, model=target[r["task"]])
        new += cost(r)
    return new

new = what_if(rows, target)
print(f"${total:,.0f} -> ${new:,.0f} ({1 - new/total:.1%} lower)")
$3,470 -> $2,769 (20.2% lower)
upper bound: assumes the cheap model passes your eval on every moved requestMoving every premium classify, extract, and summarize request to the cheap tier cuts this synthetic bill by 20.2%. That's the ceiling, not the forecast. Some of those requests are on Sonnet because a cheap model failed on them. The only honest way to find out is to replay them, or shadow them in production, and grade the outputs before you switch.
The bigger number is the 72.6% sitting in agent steps. A blanket swap won't get at it, because some steps need a frontier model and many don't. That's per-step routing, deciding at the subtask instead of the session.
Step 5: count your model strings.
One more check, because one in three teams changed labs last month:
grep -rEo '"(claude|gpt|gemini|deepseek|kimi|glm|grok)[-a-z0-9.]*"' \
  --include='*.py' --include='*.ts' --include='*.yaml' . \
  | cut -d: -f2 | sort | uniq -c | sort -rn
If that list is long and spread across many files, every model change in the index above is a code change for you. Move the choice to one place, whether that's a config table, a gateway alias, or a router, so the next price cut or launch is a policy update, not a pull request in twelve services.
What to do with your split.
- Compute it monthly. Token share and spend share per model and per task, from your own export. It's 40 lines of Python and it's the number the Vercel index can't give you.
- Separate the two questions. "Are simple tasks on the right model?" and "Is the agent loop too expensive?" have different fixes. The first is placement. The second is per-step routing, caching, and context size.
- Treat the move as an experiment. Price it as an upper bound, then replay or shadow before you switch. A cheap model that fails costs you a retry and possibly a user.
- Keep the premium tier. The index's own data says the teams adding open-weight models kept paying for frontier ones. The goal is the right model per request, not the cheapest model everywhere.
- Plan for churn. The cheap tier's price can move too. A setup that can switch models without a deploy is worth more each month the switching rate goes up.
Where Nadir fits.
The index shows production teams running a two-tier stack by hand. Nadir makes that a per-request decision. Point your OpenAI- or Anthropic-compatible client at Nadir, set model="auto", and each prompt goes to the cheapest model in your configured set that clears the quality bar you set for that API key, with a pinned model whenever you need one. Response headers show the model chosen, the cost, and the reason, so the split from this tutorial is something you read off the dashboard instead of rebuilding from an export.
Because the choice lives in one place, a new launch or a price change is a policy update, not a code change. With BYOK you keep your own provider accounts and rates, and failover moves traffic along your chain when a provider is down.
Nadir prices on what it saves you, measured on the requests it executed against the baseline you declare. With your own keys, you pay 25% of the first $2,000 of measured monthly savings and 10% above that, so if routing saves you nothing, it costs you nothing. You can start in Observe mode, which records the decision Nadir would make on each request without changing any response, and gives you your own version of the 71/23 split before you route anything. Start with a free key, or put your token mix into the savings calculator.
Conclusion.
Vercel's index is the clearest picture yet of how production teams spend on inference: cheap models for the volume, frontier models for the hard work, and a menu that changes every month. 71.5% of tokens for 23% of dollars isn't a sign that the frontier is losing. It's a sign that teams have learned to split the work. Most of them are still doing it by hand. Compute your own split, find out which side of it your dollars are on, and move the model choice somewhere you can change it without a deploy.
Sources: [Vercel, "Open weight takes 71.5% of tokens and 23% of spend"](https://vercel.com/blog/ai-gateway-production-index-october-2026), AI Gateway Production Index, October 15, 2026, for token and spend shares, spend growth, price per token, models per team, switching rates, provider and launch figures, and methodology (anonymized aggregate traffic through September 2026, spend estimated at list prices, switching measured on paid teams with at least 10 million paid tokens in both months); [Vercel AI Gateway leaderboards](https://vercel.com/ai-gateway/leaderboards/models). Found via [Token Cost Radar](https://jcodemunch.com/radar/2026-10-16), October 16, 2026. The usage log, rate card, and tutorial output are synthetic and illustrative, not Nadir customer data.