TL;DR.
Menlo Ventures published 2026: The State of Enterprise AI on November 3. It's the most-cited spend dataset of the year, and one finding should worry anyone building a 2027 AI budget: the average enterprise spent 4.7x what it spent last year, against a plan of 1.9x. That's about 2.5x over plan. The report also shows where the overrun came from, and it isn't mostly price.
- Tokens moved up the price ladder. Frontier models went from 18% to 42% of enterprise tokens in a year, and from 35% to 63% of spend. Smaller closed models fell from 29% to 13% of tokens. Companies didn't start buying pricier models one at a time. Their default traffic moved up.
- The price cuts landed where the traffic left. Frontier labs cut small-model prices by 80% or more, but the blended closed-model price fell only 24%, to $0.70 per million tokens. The cheap tiers got cheaper just as companies stopped using them.
- Mix alone is worth about 40%. In our illustrative model, moving from the 2025 tier mix to the 2026 mix raises the blended price from $0.639 to $0.894 per million tokens with no extra tokens and no price change. A budget planned at 1.9x lands at about 2.66x from mix alone.
- Agents are 80% of the tokens, and output is most of their bill. Menlo puts agents at 80% of OpenRouter tokens. A cached agent session at Menlo's mix is 2% output tokens but 56% of the dollars, because output costs 100x a cache read on Opus 5.5.
- Below is mixshift.py, under 70 lines of Python that read two months of usage and split the change in spend into volume, mix, and rate. That's the breakdown you need before you set next year's number.
Report figures are from Menlo Ventures, "2026: The State of Enterprise AI," published November 3, 2026, based on a survey of nearly 400 U.S. enterprise decision-makers fielded September 8 to 26, 2026, plus OpenRouter traffic data. Prices are Anthropic list prices retrieved November 6, 2026. The tier-mix model is ours and illustrative. No figure here comes from Nadir customer data.
The numbers that matter.
Menlo's report is long. These are the figures that bear on cost, all quoted from the report:
| Finding | 2025 | 2026 |
|---|---|---|
| Enterprise generative AI deployment spend | $33B | $176.8B (5.4x) |
| Average enterprise spend vs prior year, actual | 4.7x | |
| Average enterprise spend vs prior year, planned | 1.9x | |
| Median enterprise spend vs prior year, actual / planned | 2.2x / 1.8x | |
| Frontier models, share of tokens | 18% | 42% |
| Frontier models, share of spend | 35% | 63% |
| Smaller closed models, share of tokens | 29% | 13% |
| Open-source models, share of tokens | 11% | 19% |
| Open-source models, share of spend | 6% | 4% |
| Average open-source price per million tokens | $0.13 (down 3.3x) | |
| Blended closed-model price per million tokens | $0.70 (down 24%) | |
| Agents' share of OpenRouter tokens | 80% |
Two things stand out. The median company overshot its plan by about 20%, but the average company overshot by about 150%, so a minority of heavy spenders blew through their plans by a lot. Uber, which said it spent its 2026 AI budget in four months, is the public example. And the mix moved much more than the prices did.
Tokens moved up the price ladder.
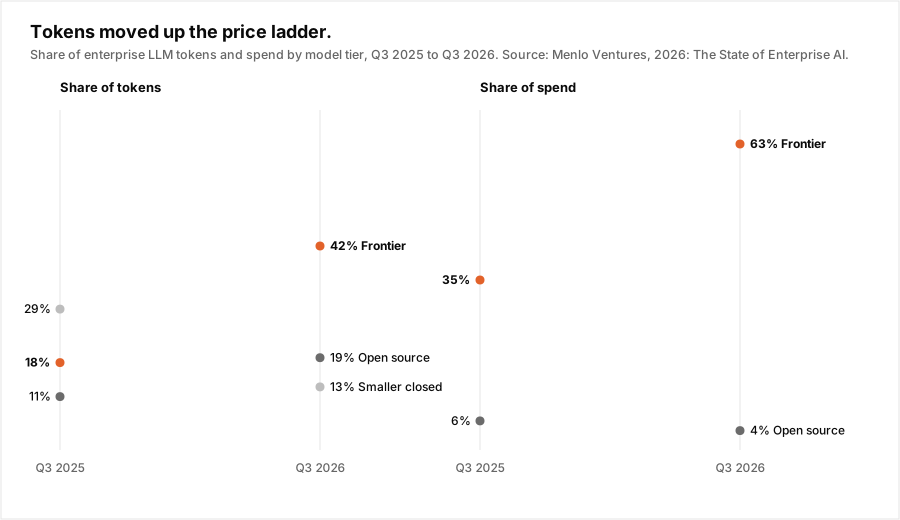
Frontier models now carry 42% of enterprise tokens, up from 18%. The tier that lost the most is smaller closed models, the Haiku and Luna class, which fell from 29% to 13%. Open source grew from 11% to 19% of tokens, but because it's so cheap, its share of spend fell to 4%. One token in five, one dollar in 25.
Menlo's figures also give a rough price ratio. In 2025, frontier carried 35% of spend on 18% of tokens, so a frontier token cost about 1.9x the average token. In 2026 it was 63% on 42%, or 1.5x the average. That ratio fell because the average token got more expensive, not because frontier got cheaper.
Nothing in the report says why the mix moved, but the timing fits a known pattern. Agents took over traffic in early 2026, and most agent frameworks ship with one model setting. Teams pick the strongest model so the hard steps work, and every other step inherits it. It's the one-model-for-everything setting we looked at in The Blanket Swap, pointed the other way. Menlo's data suggests it's now happening across the whole market.
The price cuts landed where the traffic left.
This year was full of price-cut headlines. Frontier labs cut small-model prices by 80% or more, according to Menlo, and Claude Haiku 5.5 launched at $0.10 per million input tokens. But the blended closed-model price, the number your invoice actually feels, fell only 24%.
The cuts were real. They just landed on the tier companies were leaving. A company that moved most of its traffic from Haiku-class models to Opus-class models in 2026 didn't benefit from the Haiku cut, and it paid the Opus rate on far more tokens. We covered the same effect at the level of a single price cut in Which Cut Was Yours?. Menlo's report shows it for the market as a whole.
What the mix shift costs.
To put a number on it, we priced Menlo's tier shares with today's Anthropic rates and Menlo's open-source average. Frontier is Opus 5.5, smaller closed is Haiku 5.5, and the tokens Menlo doesn't assign to a tier (42% in 2025, 26% in 2026) go to Sonnet 5.5 as a mid tier. Every tier uses the same token mix: 10% fresh input, 85% cache reads, 5% output.
| Tier | Model | $ / M blended | 2025 share | 2026 share |
|---|---|---|---|---|
| Frontier | Claude Opus 5.5 | $1.570 | 18% | 42% |
| Mid (unassigned remainder) | Claude Sonnet 5.5 | $0.785 | 42% | 26% |
| Smaller closed | Claude Haiku 5.5 | $0.044 | 29% | 13% |
| Open source | Menlo average | $0.130 | 11% | 19% |
| Blended | $0.639 | $0.894 |
At the same volume and the same prices, the 2026 mix costs 40% more per token than the 2025 mix. Planning for 1.9x growth on the old mix and moving to the new one lands at about 2.66x, before a single extra token is counted. That's not Menlo's estimate, it's our arithmetic on their shares, but it shows why the plan missed. Budgets were set on volume growth, and most volume models assume the mix stays fixed.
In our model, 22 billion tokens a month at the 2026 mix is $19,665 a month, about $236,000 a year. Run the same tokens at the 2025 mix and it's about $169,000.
Agents: 80% of the tokens, and output is most of their bill.
Menlo puts agents at 80% of OpenRouter tokens, about 130.9 trillion a week, up 37x since they passed human traffic in early February. The report also gives the shape of a typical agent session: cache reads can be 95% or more of tokens, with about 3% fresh input and 2% output, which comes to about $0.70 per million tokens on Opus 5.5.
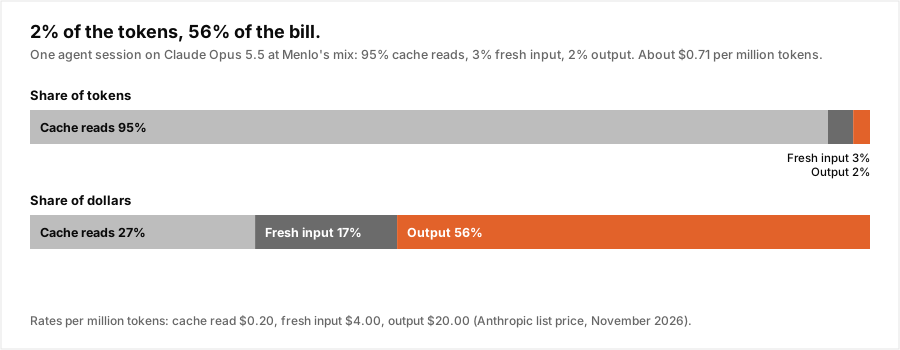
We checked the math: 95% at $0.20, 3% at $4, and 2% at $20 comes to $0.71 per million. The surprise is where the dollars go. Output is 2% of the tokens and 56% of the bill. Cache reads are 95% of the tokens and only 27% of the bill.
That changes which levers matter for agent spend:
- Prompt compression on a cached prefix saves less than you'd think. Shrinking a prefix that's already billed at $0.20 per million mostly cuts the cheapest line. Compression still pays on fresh input and on prefixes that miss the cache.
- Losing the cache is expensive. If the hit rate falls from 85% to 75%, the blended price in our model rises 24%. A router that switches models mid-session invalidates the cache on every switch. Read Your Router Is Fighting Your Prompt Cache before you route inside a session.
- The model that writes the output sets the price. The same session costs $0.355 per million on Sonnet 5.5 and about $0.023 on Haiku 5.5. Output length and the model writing it are most of the bill.
Four levers on the same bill.
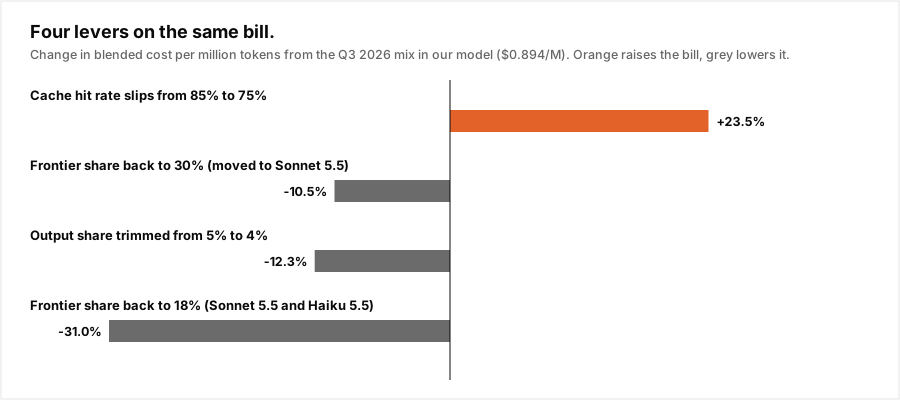
Starting from the 2026 mix in our model:
- Route per step, not per product. Moving frontier share from 42% back to 18%, with the freed tokens split between Sonnet 5.5 and Haiku 5.5, lowers the blended price 31%. Moving only to 30%, all on Sonnet, lowers it about 11%. The question isn't which model your product uses. It's which model each step needs. See Route the Step for how that works inside an agent loop.
- Protect the cache. A 10-point drop in hit rate adds 24%, which wipes out most of a routing saving. Route at session or task boundaries, or route only the calls that don't share a prefix.
- Cap output where it's padding. Cutting the output share from 5% to 4% lowers the bill 12%. That's reasoning effort and thinking budgets on steps that don't need them, and tighter
max_tokenson structured steps. - Budget the mix, not just the volume. A plan that only forecasts tokens will miss again next year if the mix moves again. Track frontier share as its own line, the same way you track headcount by level.
These levers stack, but not cleanly. Routing more tokens to cheaper models also shrinks the share of output billed at $20, so the combined saving is less than the sum. The order we'd apply them in is in the stacking order post.
Tutorial: mixshift.py.
Before you set a 2027 number, split this year's growth into three parts. Volume is more tokens. Mix is tokens moving between tiers. Rate is a change in what a tier costs per token, either because the rate card changed or because your cache hit rate or output share did. Each one has a different owner and a different fix.
Export two months of usage from your provider console or gateway as CSV with model,input,cache_read,output columns. Edit PRICES to your rate card and tiers. Any model missing from PRICES raises an error, so nothing gets silently priced at zero.
"""mixshift.py: split a change in LLM spend into volume, mix, and rate.

Feed it two months of usage (model, fresh input, cache read, output tokens).
It prints each month's tier mix and blended $/M, then says how much of the
change came from more tokens, from moving tokens to pricier tiers, and from
each tier's own cost per token. Unknown models raise, so nothing is priced at $0.
"""
import csv
import sys
from collections import defaultdict

# $ per million tokens: fresh input, cache read, output. Edit to your rate card.
PRICES = {
    "claude-opus-5-5":   ("frontier", 4.00, 0.20, 20.00),
    "claude-sonnet-5-5": ("mid",      2.00, 0.10, 10.00),
    "claude-haiku-5-5":  ("small",    0.10, 0.01, 0.50),
    "glm-5.3":           ("open",     0.13, 0.13, 0.13),  # Menlo avg, flat
}


def load(path):
    """Rows of model,input,cache_read,output -> {tier: [tokens, dollars]}."""
    tiers = defaultdict(lambda: [0.0, 0.0])
    with open(path) as f:
        for r in csv.DictReader(f):
            tier, p_in, p_read, p_out = PRICES[r["model"]]   # KeyError = unpriced
            i, c, o = (float(r[k]) for k in ("input", "cache_read", "output"))
            tiers[tier][0] += i + c + o
            tiers[tier][1] += (i * p_in + c * p_read + o * p_out) / 1e6
    return tiers


def decompose(a, b):
    """Return (volume, mix, rate) dollar effects from month a to month b."""
    va = sum(t for t, _ in a.values())
    vb = sum(t for t, _ in b.values())
    rate = lambda m, k: m[k][1] / m[k][0] * 1e6 if m.get(k, [0])[0] else 0.0
    share = lambda m, v, k: m[k][0] / v if k in m else 0.0
    keys = set(a) | set(b)
    # Price a tier that is new in b at b's rate, and a dropped one at a's.
    ra = {k: rate(a, k) or rate(b, k) for k in keys}
    rb = {k: rate(b, k) or rate(a, k) for k in keys}
    pa = sum(share(a, va, k) * ra[k] for k in keys)          # $/M, month a
    p_mix = sum(share(b, vb, k) * ra[k] for k in keys)       # b's mix, a's rates
    pb = sum(share(b, vb, k) * rb[k] for k in keys)
    volume = (vb - va) * pa / 1e6
    mix = vb * (p_mix - pa) / 1e6
    rate_fx = vb * (pb - p_mix) / 1e6
    return volume, mix, rate_fx


def report(a_path, b_path):
    a, b = load(a_path), load(b_path)
    for name, m in (("before", a), ("after", b)):
        v = sum(t for t, _ in m.values())
        d = sum(x for _, x in m.values())
        mix = "  ".join(f"{k} {m[k][0] / v:.0%}" for k in sorted(m))
        print(f"{name:>6}: {v / 1e9:.2f}B tokens  ${d:,.0f}  ${d / v * 1e6:.3f}/M  {mix}")
    volume, mix, rate_fx = decompose(a, b)
    total = volume + mix + rate_fx
    for label, x in (("volume", volume), ("mix", mix), ("rate", rate_fx)):
        print(f"{label:>6}: {x:+,.0f}  ({x / total:.0%} of the change)")


if __name__ == "__main__":
    report(sys.argv[1], sys.argv[2])
Run on two synthetic months built from Menlo's tier shares, 10 billion tokens at the 2025 mix and 22 billion at the 2026 mix, it prints:
$ python mixshift.py q3-2025.csv q3-2026.csv
before: 10.00B tokens  $6,392  $0.639/M  frontier 18%  mid 42%  open 11%  small 29%
 after: 22.00B tokens  $19,665  $0.894/M  frontier 42%  mid 26%  open 19%  small 13%
volume: +7,671  (58% of the change)
   mix: +5,602  (42% of the change)
  rate: +0  (0% of the change)
In that example, 42% of the growth in spend came from mix. Volume belongs to whoever owns adoption, and you probably want it to grow. Mix belongs to whoever picks the models, and it's the part you can lower without using AI any less. Rate is zero here because both months use the same rate card and token shape. On real data it moves when a price changes, when the cache hit rate shifts, or when outputs get longer.
To go one level deeper, add a feature or team column and run the same split per group. The chargeback tutorial shows how to tag requests so that column exists.
When not to bother.
- Your spend is on plan. The median company in Menlo's survey landed at 2.2x against a 1.8x plan. If you're close to plan, a mix review is housekeeping, not an emergency.
- Your traffic really is hard. If most of your frontier tokens are on long-horizon coding or research steps that fail on cheaper models, the mix is correct. Routing would add a step and save little. Check that with an eval before you assume it.
- You run one model on a seat plan. If you pay per seat for Claude Code or Codex, you don't pay per token. Mix is the vendor's problem, and it shows up as plan limits instead of a bill.
- Most of your bill is cache reads. At a 95% cache-read share on a cheap model, there's little left to route. Look at output length first.
Where Nadir fits.
mixshift.py tells you how much of the overrun is mix. Nadir is a way to move the mix back down without rewriting every agent's model setting.
Per-request routing through one endpoint. Point your OpenAI or Anthropic client at Nadir's gateway and set model="auto". A trained classifier sends each request to the cheapest model you've allowed that clears your quality floor, so frontier share becomes a decision per request instead of a default per product. POST /v1/bucket labels a prompt simple, medium, or complex without a provider call if you'd rather keep your own routing code.
The mix, per request. Every response reports the model that served it and what it cost, so the model column mixshift.py needs comes from your own logs, with no billing export.
Measure before you switch. Observe mode serves exactly the model you asked for and records what routing would have chosen. Run it on a week of traffic and you get your own version of the tier table above before anything changes. With your own provider keys, the provider bills you directly, and Nadir charges a flat $0.002 per request, with the first 50 requests a month free. Savings depend on your workload, and nothing in this post forecasts yours.
Start with a free key, or estimate your savings from your current model spend.
Conclusion.
Menlo's report reads as a growth story, and it is one. Enterprise AI spend grew 5.4x in a year. But the 2.5x gap between what the average company planned and what it spent isn't explained by volume alone. Frontier models went from under a fifth of tokens to over two fifths, and the cheap tiers got cheaper just as traffic left them. If your 2027 plan forecasts tokens and assumes the mix stays put, you're making the same assumption that missed in 2026. Measure the mix, give it an owner, and route the steps that don't need the top model.
Sources: [Menlo Ventures, "2026: The State of Enterprise AI," November 3, 2026](https://menlovc.com/perspective/2026-the-state-of-enterprise-ai/), by Tim Tully, Joff Redfern, Deedy Das, and Derek Xiao. [Anthropic, Pricing](https://platform.claude.com/docs/en/about-claude/pricing), retrieved November 6, 2026: Opus 5.5 $4 input, $0.20 cache read, $20 output. Sonnet 5.5 $2, $0.10, $10. Haiku 5.5 $0.10, $0.01, $0.50 for prompts up to 100K tokens, per million tokens. Report figures are survey and traffic estimates from Menlo, not audited results. The tier model is ours and illustrative: Menlo's tier shares priced at those rates, the tokens Menlo doesn't assign to a tier priced as Sonnet 5.5, open source priced at Menlo's $0.13 average, and every tier at 10% fresh input, 85% cache reads, and 5% output.