Abstract.
Every confidence-gated router has a number in it: escalate to the stronger model when confidence in the cheap answer falls below some cutoff. That number gets picked in the first week, usually 0.7 because 0.7 looks reasonable, and nobody touches it again. This post sweeps it end to end as a continuous parameter, tracing cost, mean latency, and task success as functions of the threshold instead of comparing a few named configurations. Three things fall out. Task success saturates at 0.73 in this model and then declines while cost keeps climbing, so the top of the range is strictly dominated. The cost-quality frontier has a knee at 0.53, below which a point of task success costs $0.24 and above which the same point costs $2.35. And at a conservative 0.90 cutoff, 63.7% of all requests pay for a second model hop the cheap model had already answered correctly. All figures are illustrative, from an analytical model with a synthetic confidence distribution. They are not measured production traces and not a benchmark result.
Research question.
Cascade routing is well studied and the savings are real. FrugalGPT (Chen, Zaharia, and Zou, arXiv:2305.05176) reported matching the best individual LLM with up to 98% cost reduction by trying cheap models first and escalating only when a scoring function says the answer isn't good enough. RouteLLM (arXiv:2406.18665, July 2024) reported over 85% cost reduction on MT Bench while retaining 95% of GPT-4 performance. Hybrid LLM (Ding et al., ICLR 2024, arXiv:2404.14618) reported up to 40% fewer calls to the large model with no drop in response quality.
That literature is quieter about where the operating point should sit once the router ships. RouteLLM's README is direct about it: "the threshold used for routing controls the cost-quality tradeoff," with a worked calibration ("For 50.0% strong model calls for mf, threshold = 0.11593") and a recommendation to calibrate on a dataset that resembles the queries you actually receive. That's a per-deployment number derived from a distribution that drifts. In practice it gets set once.
The research question: as a router's escalation threshold sweeps continuously from aggressive to conservative, how do cost, latency, and task success move, and where does the curve stop buying quality and start buying only cost?
Methodology.
This is an analytical model, not a measurement. The workload is a confidence-gated cascade of the shape most production systems converge on: the cheap model answers first, a verifier scores that answer, and the request escalates to a premium model when the score falls below the threshold. Escalated requests pay for both hops, which is what makes the latency question interesting.
The confidence distribution is synthetic and deliberately imperfect. 72% of traffic is work the cheap model handles correctly, with verifier confidence drawn from Beta(6.0, 2.2); the other 28% is work it gets wrong, drawn from Beta(2.0, 4.5). The two overlap, which is the point: no verifier is perfectly calibrated.
Illustrative prices, consistent with current cheap-tier and frontier-tier rates: $1.50 per 1,000 requests on the cheap model, $18.00 per 1,000 on the premium model, $0.06 for the verifier pass. Latency: 0.90s cheap, 0.15s verifier, 2.60s added for a premium hop. The premium model succeeds on 97% of tasks, not 100%.
Quality saturates long before escalation does.
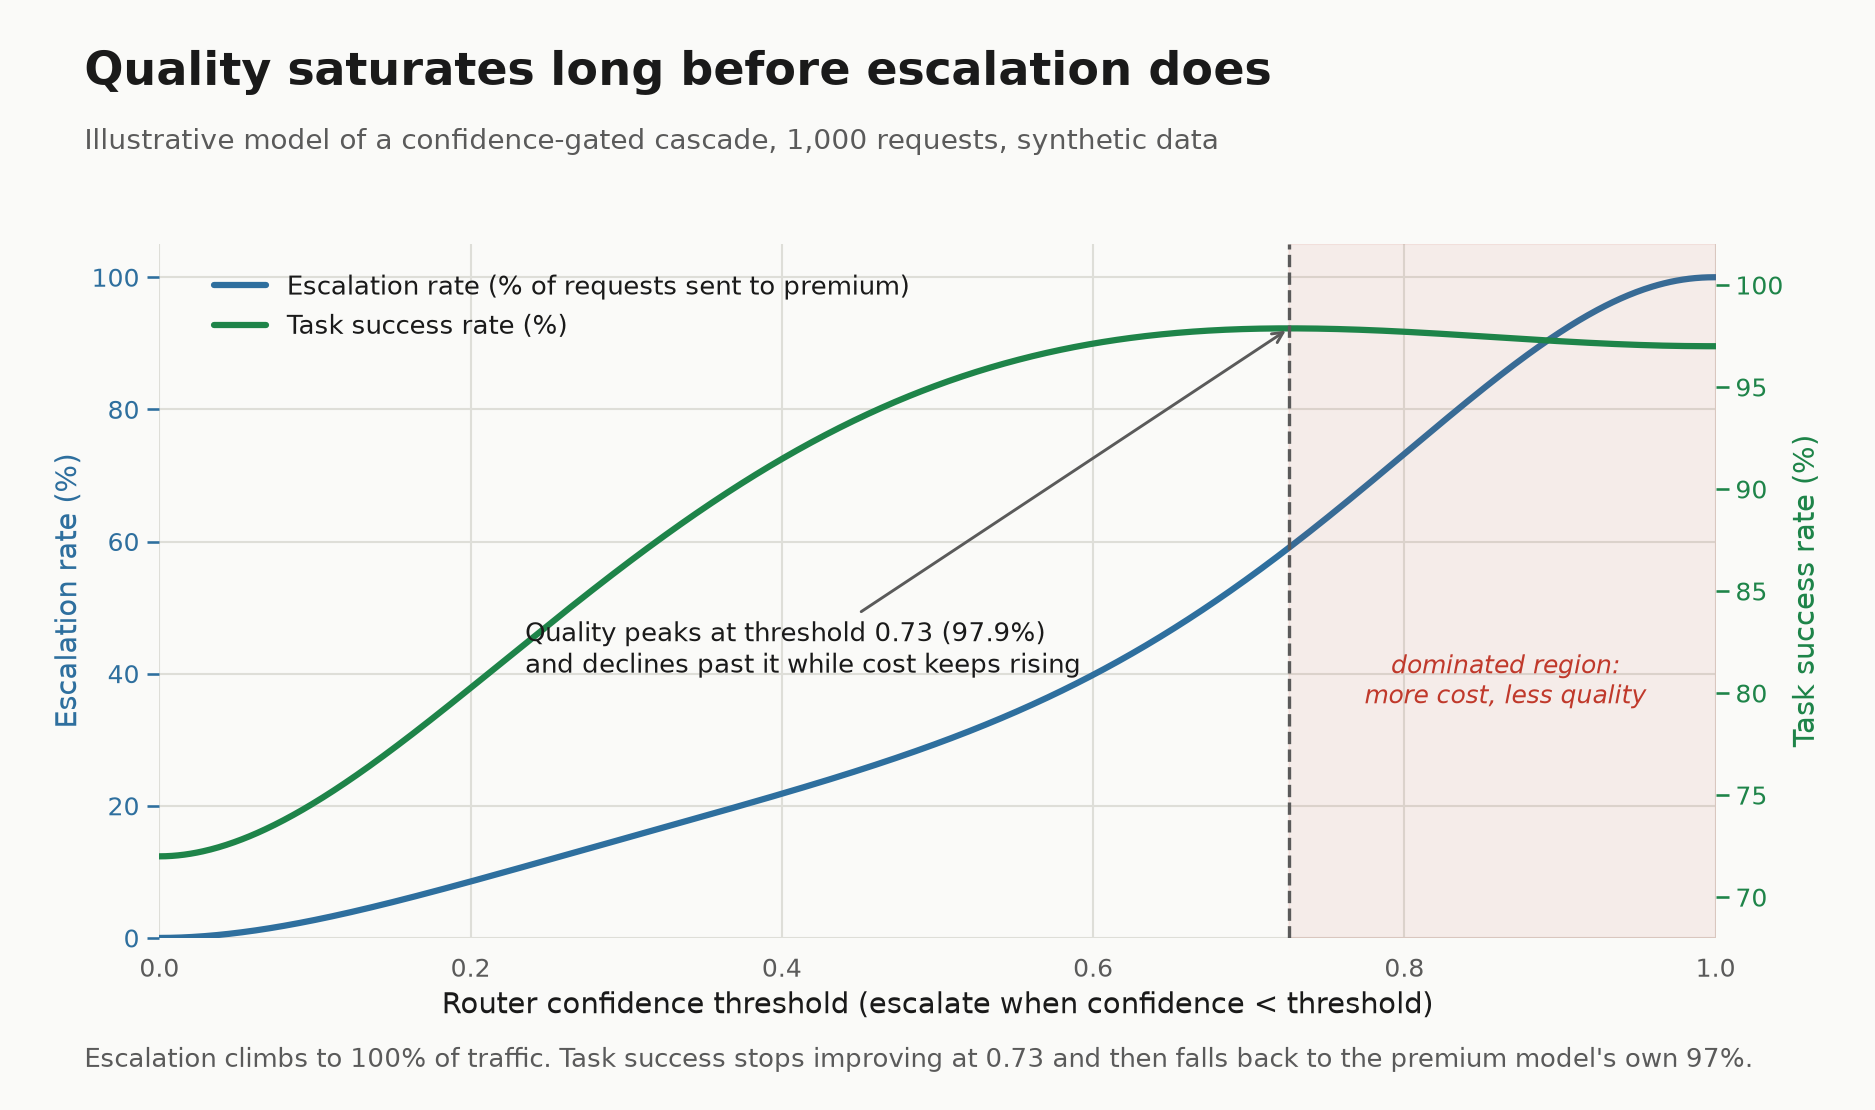
The two curves have different shapes, and that difference is the finding. Escalation rate is monotonic: raise the threshold, escalate more, up to 100% of traffic. Task success is not. It rises steeply, flattens around 0.65, peaks at 97.9% at 0.73, then falls back toward 97.0%.
That decline isn't an artifact. Past the peak, the marginal escalated request is one the cheap model had already answered correctly, handed to a model with a 97% success rate. Every escalation past that point trades a correct answer for a 97% chance of one, at premium prices.
Cost is not linear in the threshold.
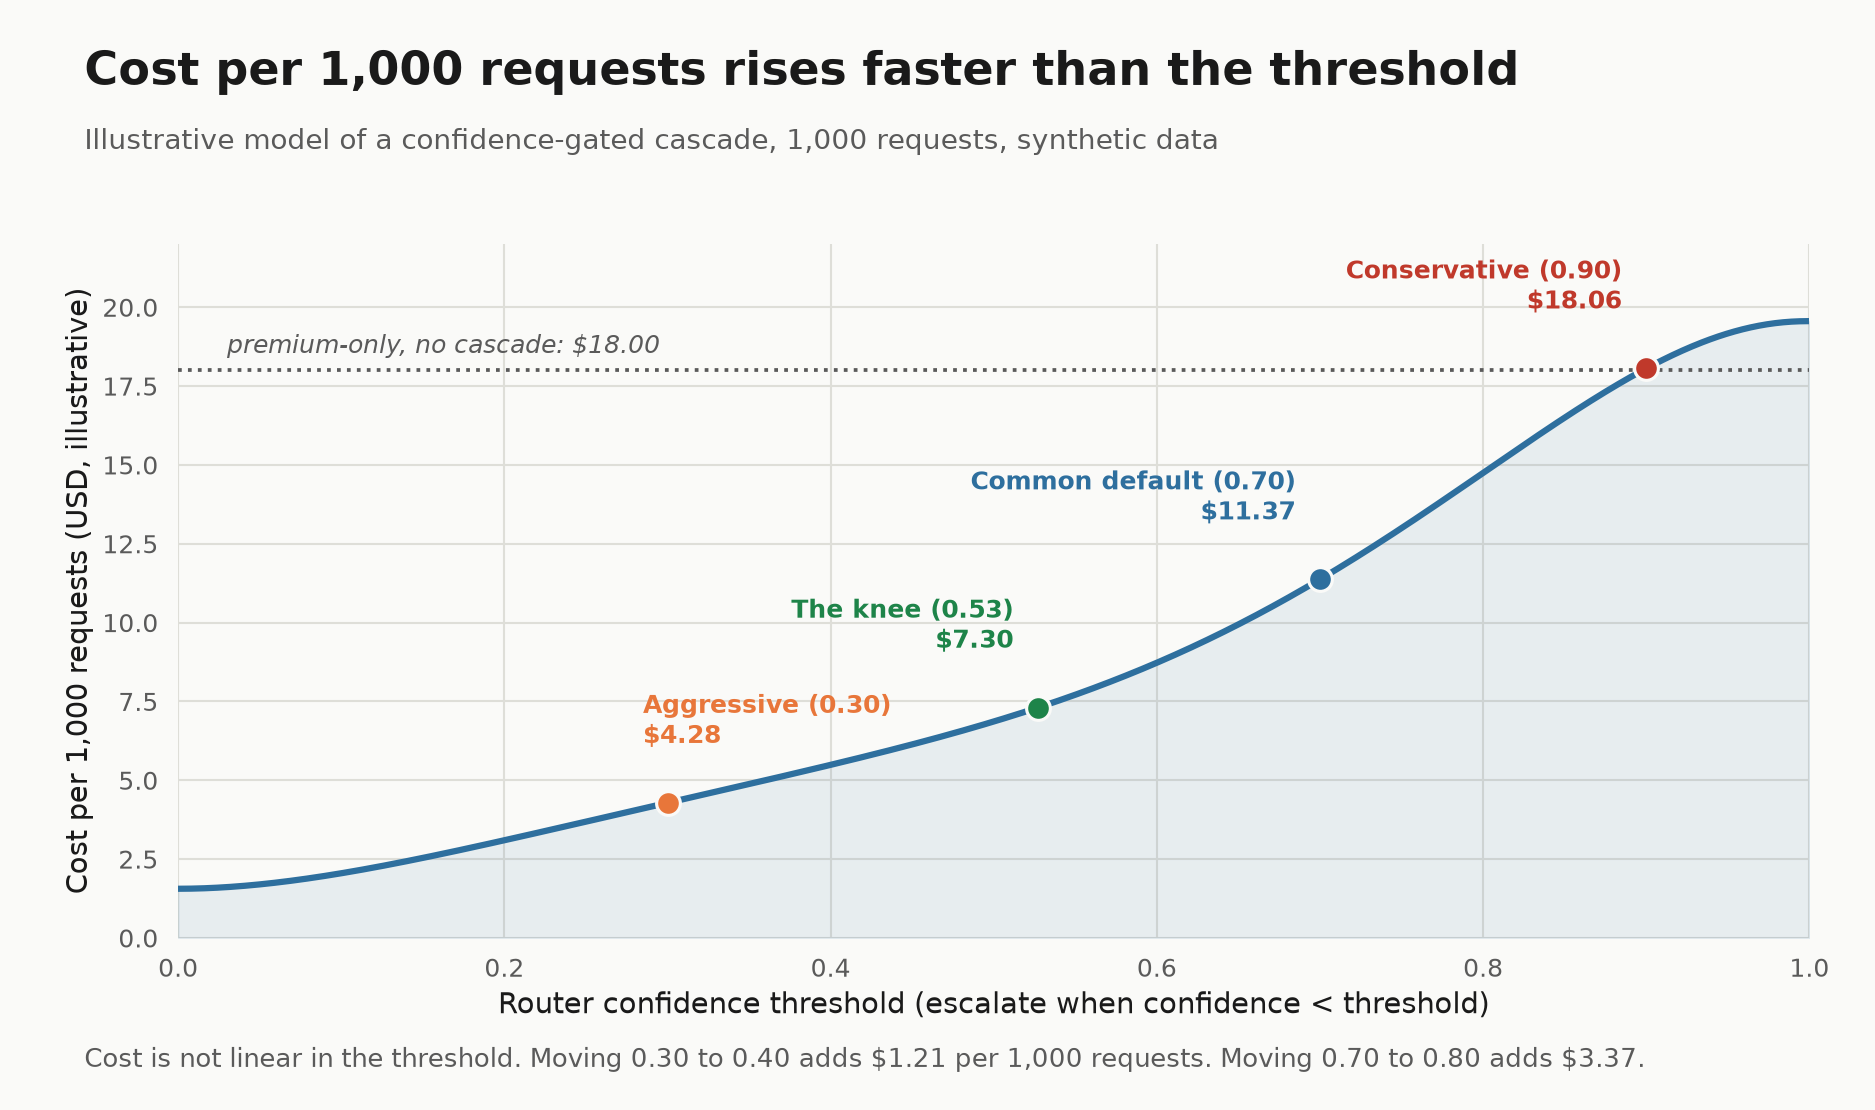
Cost runs from $1.56 per 1,000 requests at a threshold of 0.00 to $19.56 at 1.00, along an S-curve. Moving from 0.30 to 0.40 adds $1.21 per 1,000. Moving from 0.70 to 0.80 adds $3.37, nearly 3 times as much for the same 0.1, because the bulk of the confidence distribution sits there.
The dotted line matters on its own: at a threshold of 1.00 the cascade costs $19.56 per 1,000, while calling the premium model directly costs $18.00 for the same 97% success rate. A cutoff pinned high enough isn't just expensive, it's worse than having no router.
The frontier bends back on itself.
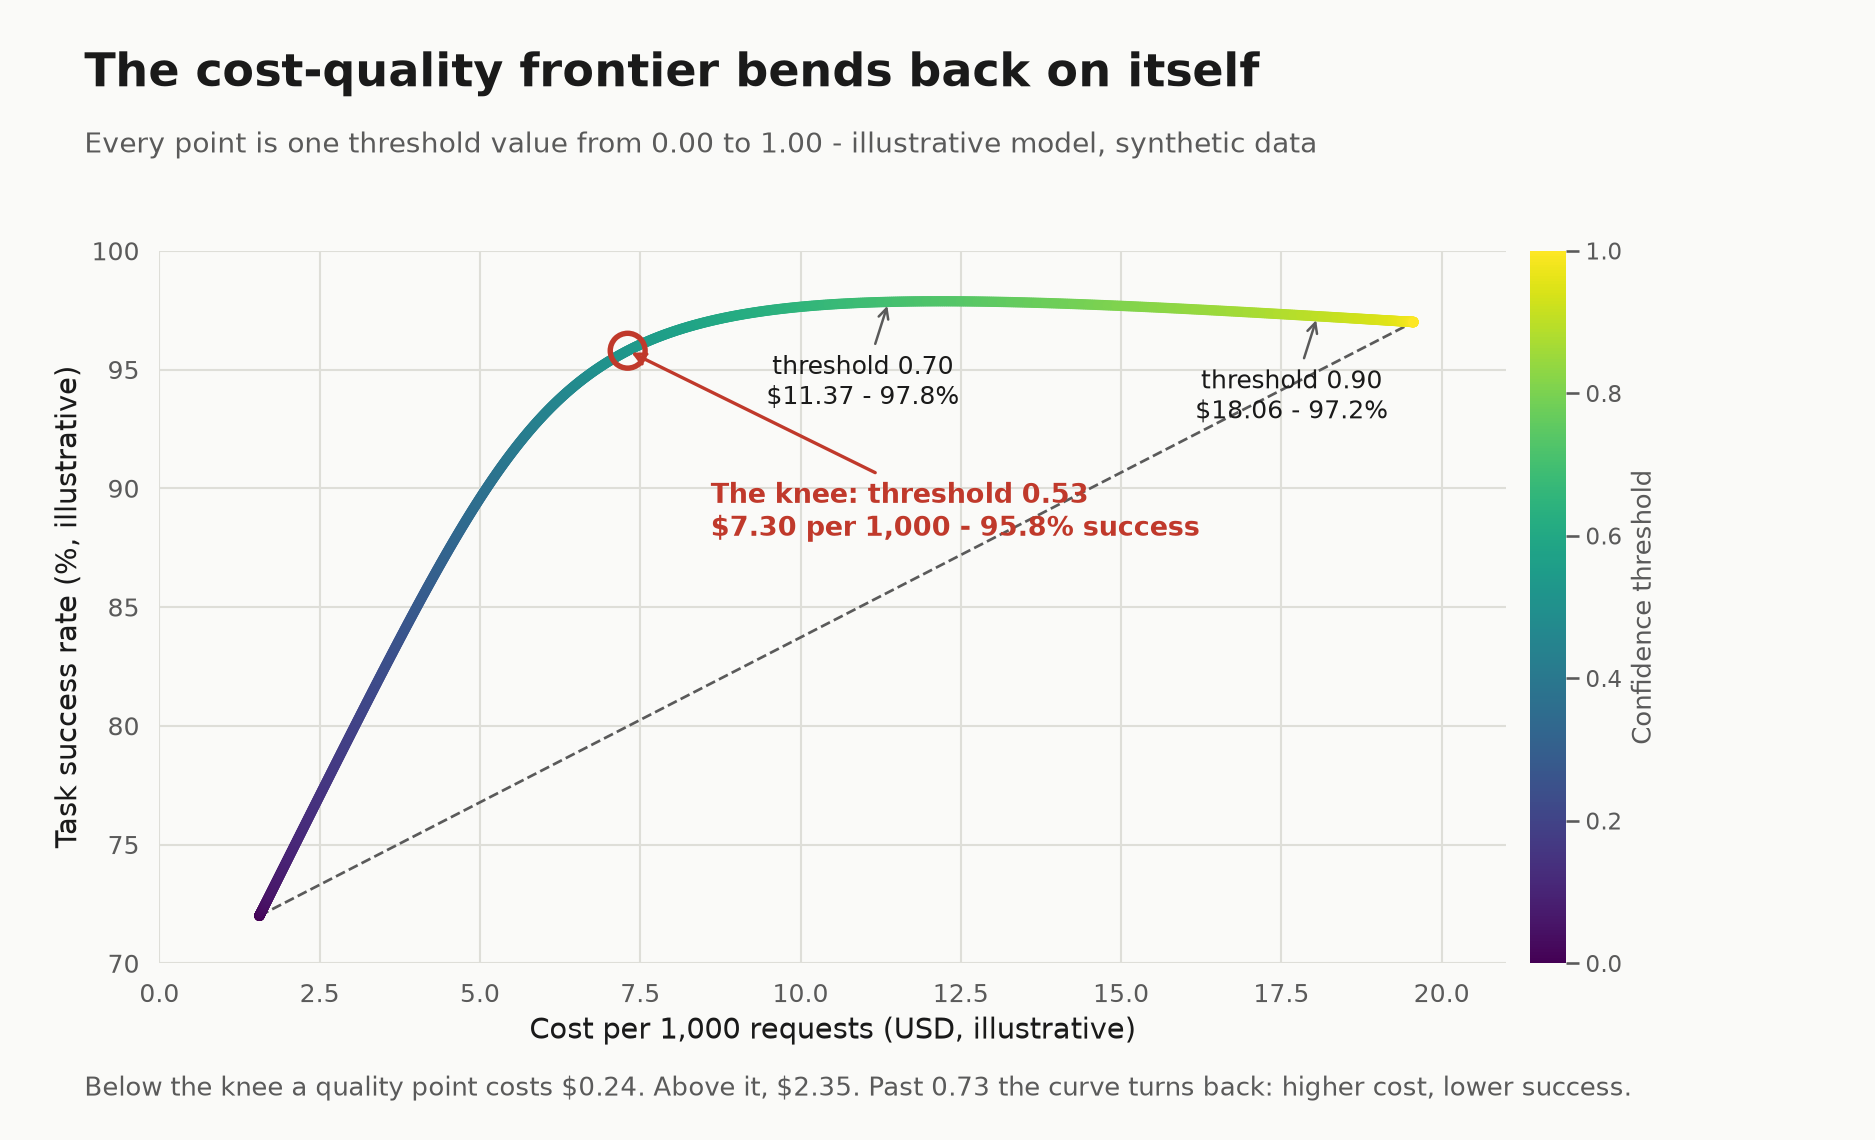
Cost on x, task success on y, each point a threshold value. It's a hockey stick with a hook on the end. The knee sits at 0.53: $7.30 per 1,000 requests at 95.8% task success. Below it, a point of task success costs $0.24; above it, $2.35, a factor of about 10. Past 0.73 the curve turns back on itself, the visual form of the dominated region from chart 1.
The knee isn't automatically the right answer. If a wrong answer is expensive in your product, buying success points at $2.35 each is rational, and the common 0.70 default lands close to the quality peak. What's never rational is sitting right of 0.73, which is exactly where a threshold set at 0.85 or 0.90 for safety lands.
Every escalation is a second model hop.
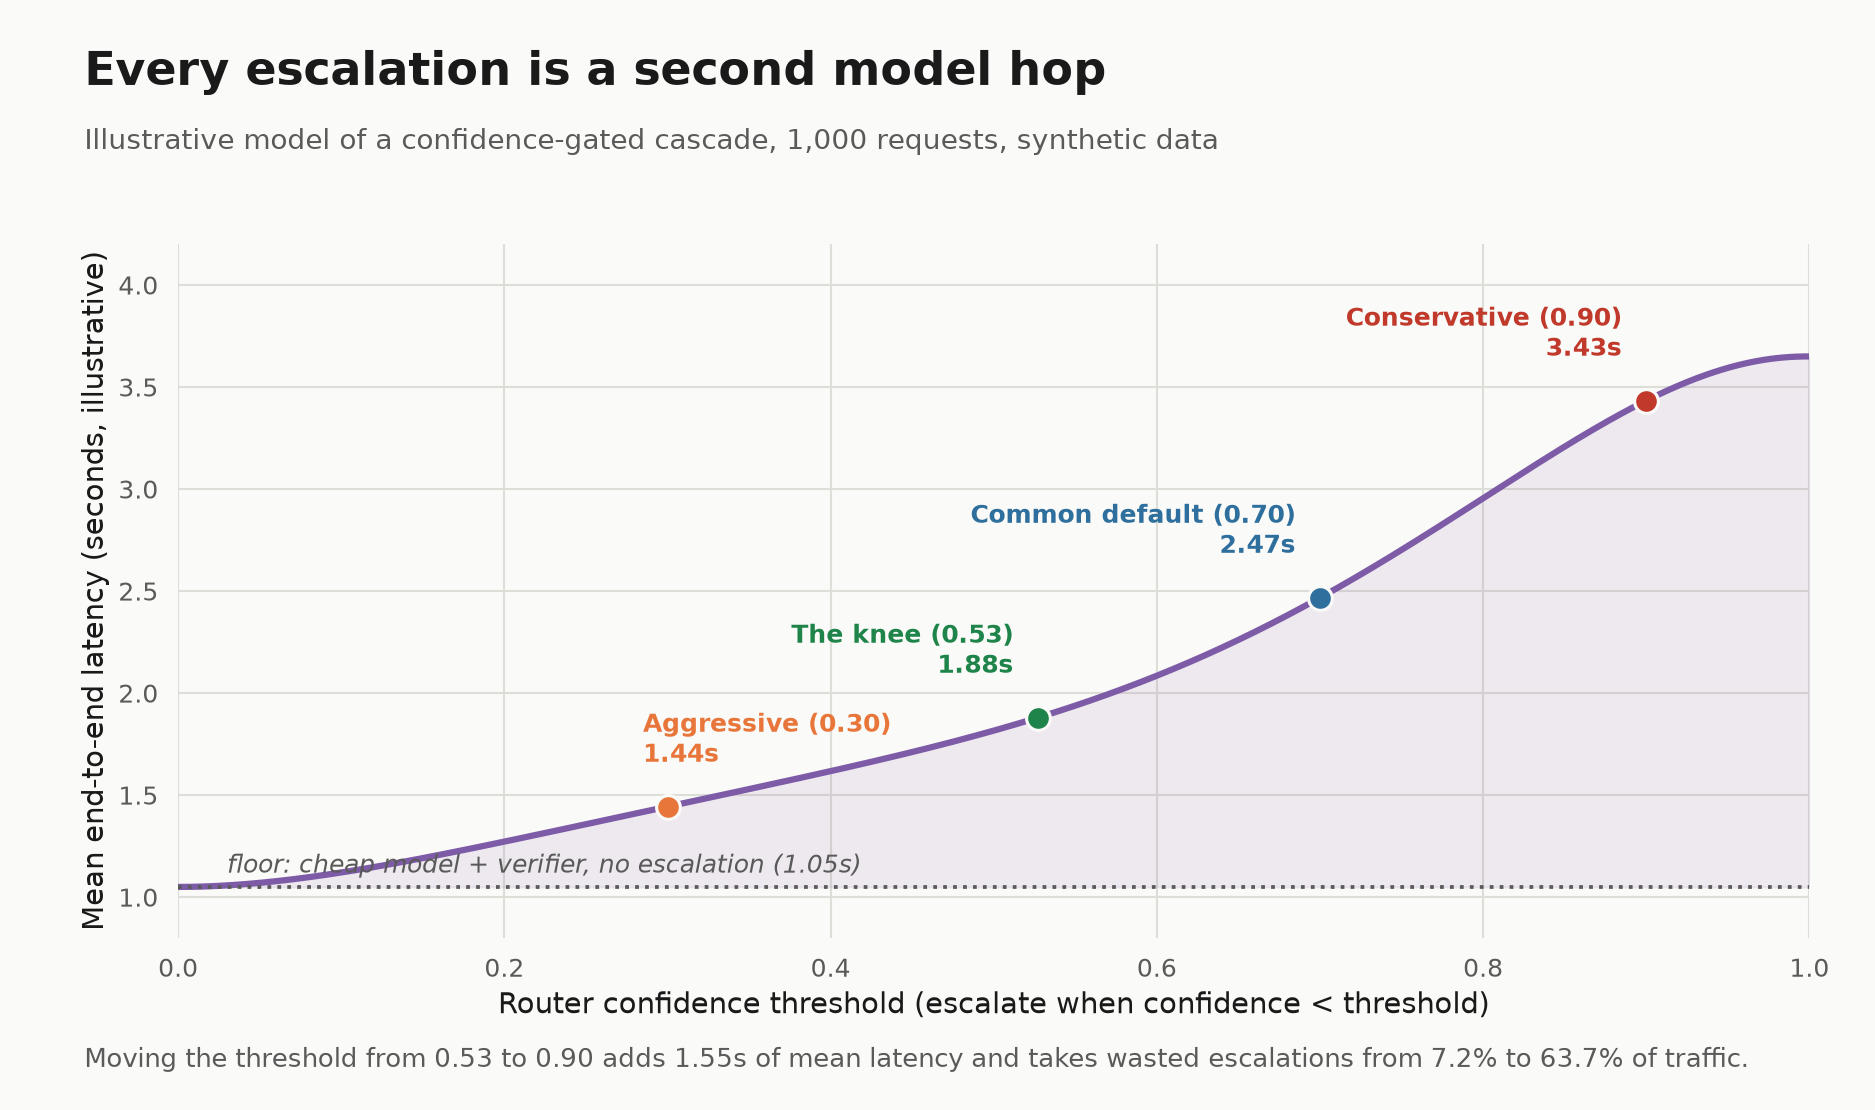
Because the cheap model has already generated an answer before the verifier scores it, an escalation is additive latency, not substitute latency. Mean latency runs from a 1.05s floor to 3.65s across the sweep, and moving from the knee at 0.53 to a conservative 0.90 adds 1.55s per request. An over-conservative threshold is billed twice, once on the invoice and once on p50. In a cascade, tuning for cost and tuning for latency are the same knob.
What the threshold actually decides.
| Threshold | Escalation rate | Cost / 1,000 | Mean latency | Task success |
|---|---|---|---|---|
| 0.30 (aggressive) | 15.1% | $4.28 | 1.44s | 86.3% |
| 0.53 (the knee) | 31.9% | $7.30 | 1.88s | 95.8% |
| 0.70 (common default) | 54.5% | $11.37 | 2.47s | 97.8% |
| 0.90 (conservative) | 91.7% | $18.06 | 3.43s | 97.2% |
| 1.00 (escalate everything) | 100% | $19.56 | 3.65s | 97.0% |
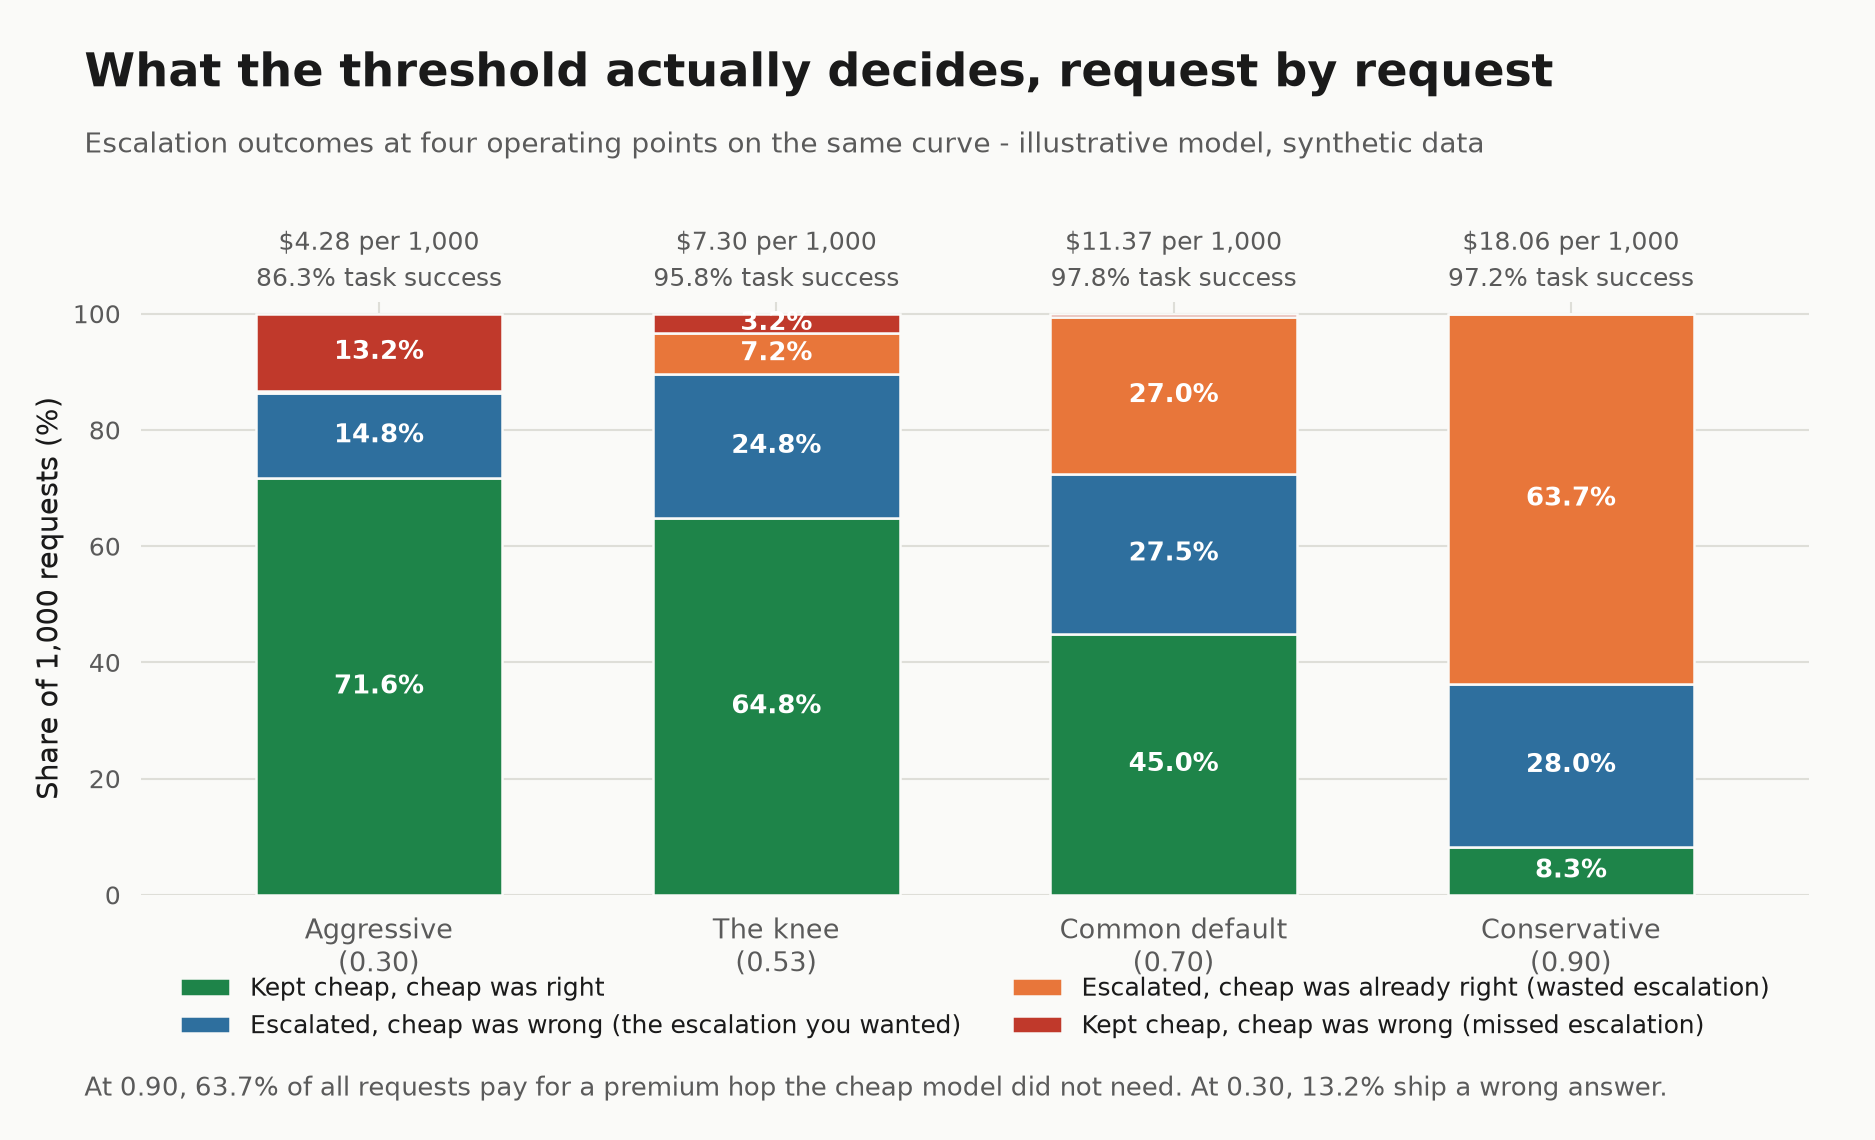
| Threshold | Kept cheap, right | Escalated, cheap was wrong | Wasted escalation | Missed escalation |
|---|---|---|---|---|
| 0.30 | 71.6% | 14.8% | 0.4% | 13.2% |
| 0.53 | 64.8% | 24.8% | 7.2% | 3.2% |
| 0.70 | 45.0% | 27.5% | 27.0% | 0.5% |
| 0.90 | 8.3% | 28.0% | 63.7% | 0.0% |
The two right-hand columns are the two ways a threshold can be wrong. At 0.30, 13.2% of requests ship a wrong answer a stronger model would have caught, and the downstream cost of that failure is usually a retry, billed in full. At 0.90, 63.7% of all requests pay for a premium hop the cheap model had already gotten right. Useful escalations never exceed 28% at any threshold, because that's the share of traffic the cheap model gets wrong in the first place, and 24.8 of those 28 points are already bought at the knee.
Discussion.
This parameter goes untuned because it isn't obviously broken at any setting. A router at 0.90 returns good answers, a router at 0.30 returns fast cheap ones, and neither throws an error or pages anyone. The gap between them in this model is a factor of 4.2 in cost, 2.0s in mean latency, and 10.9 points of task success.
Three caveats. The knee's location depends on the price ratio between your tiers and on how well separated the verifier's confidence distributions are. The shape assumes a post-generation cascade, so a pre-generation classifier has a different cost function. And the 72/28 split is an assumption about a workload, and workloads drift, so a threshold calibrated in March describes March's traffic. The measurement discipline that applies to stacking routing, compression, and caching applies here too.
Implementation guide.
Step 1: Log the confidence score on every request, not just escalated ones. You can't sweep a threshold you haven't recorded. Store the score, the routing decision, and the model that ran.
Step 2: Attach an outcome label to as much traffic as you can. A thumbs-down, a retry, an edited output, a failed test. Without it, the quality axis is a guess.
Step 3: Replay the sweep offline against logged traffic. For every candidate threshold, recompute what would have escalated and what it would have cost. Arithmetic over existing logs, not a new experiment.
def sweep(requests, thresholds, cheap_cost, premium_cost):
    # requests: (confidence, cheap_was_correct) pairs from production logs
    for t in thresholds:
        escalated = [r for r in requests if r.confidence < t]
        wasted = [r for r in escalated if r.cheap_was_correct]
        cost = len(requests) * cheap_cost + len(escalated) * premium_cost
        yield t, cost, len(wasted) / len(requests)
Step 4: Rule out the dominated region first. The threshold at which task success stops improving is a ceiling. Anything above it is spend with no quality argument behind it.
Step 5: Locate the knee, then decide how far past it to sit. Price a point of task success on both sides. If a wrong answer costs more than the marginal dollar, sit right of the knee on purpose and write down why.
Step 6: Track wasted escalation rate as a first-class metric. The share of escalations where the cheap answer was already correct is what says a threshold has drifted conservative. Invoices won't surface it: a wasted escalation looks identical to a useful one.
Step 7: Re-run the sweep on a schedule. Monthly is a reasonable cadence. Prices change, workload mix changes, and a new cheap model shifts the 72/28 split the curve is built on.
Where an efficiency layer fits.
Steps 1 through 3 are the expensive part, because most stacks don't record the routing decision alongside the outcome in a form you can replay. Nadir sits in the request path as an OpenAI compatible proxy, routes each request to the cheapest model that can handle it via model=auto, and reports each request's routing decision, cost, latency, and prompt-cache token counts in the nadir_metadata object of a non-streaming response and in the dashboard. On complete, non-streaming responses, its optional escalation step is confidence-gated in the shape modeled here: a verifier scores the completed answer and can escalate to a stronger model. Streaming bypasses it. Exposed per request, the threshold stops being a constant somebody chose in week one and becomes a curve you can plot against your own traffic.
Conclusion.
The problem isn't that teams pick a bad threshold. It's that they pick a defensible one and never look at it again, while the workload, the prices, and the model lineup move underneath it. In this illustrative model the gap between the knee and a conservative default is 2.5 times the cost and 1.8 times the mean latency for 1.5 points of task success, and the top quarter of the range buys nothing. Sweeping the parameter against logged traffic answers a question a comparison of named configurations can't: not which setup is best, but where on your own curve you're standing right now.
All figures in this post are illustrative, derived from an analytical model with a synthetic Beta-distributed confidence score and illustrative cheap-tier and frontier-tier pricing. They are not measured production traces and not a benchmark result. Sources: [Chen, Zaharia, and Zou, "FrugalGPT: How to Use Large Language Models While Reducing Cost and Improving Performance," arXiv:2305.05176, 2023](https://arxiv.org/abs/2305.05176). [Ong et al., "RouteLLM: Learning to Route LLMs with Preference Data," arXiv:2406.18665, 2024](https://arxiv.org/abs/2406.18665) and the [RouteLLM repository](https://github.com/lm-sys/RouteLLM). [Ding et al., "Hybrid LLM: Cost-Efficient and Quality-Aware Query Routing," ICLR 2024, arXiv:2404.14618](https://arxiv.org/abs/2404.14618). [Stanford Digital Economy Lab, "How are AI agents spending your tokens?"](https://digitaleconomy.stanford.edu/news/how-are-ai-agents-spending-your-tokens/)