TL;DR.
In May, the story about Uber and AI was that it burned its 2026 AI budget in four months. The sequel is better and has had less attention. In a post titled "Running a Software Factory Efficiently at Uber Scale", Distinguished Engineer Uday Kiran Medisetty lays out what happened next:
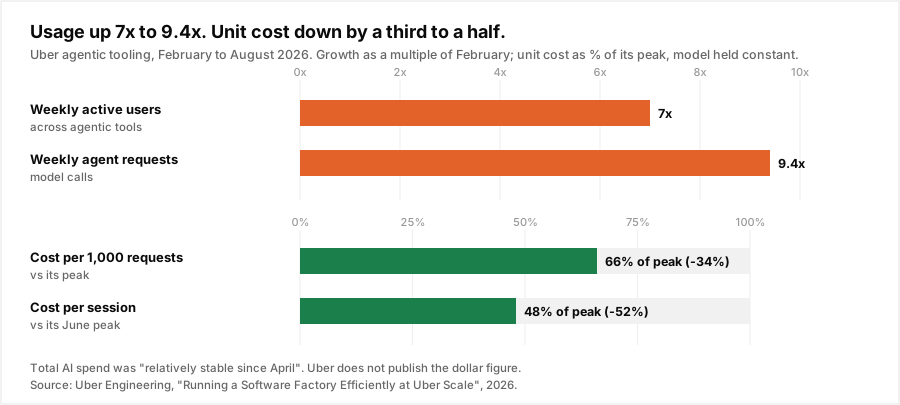
- From February to August 2026, weekly active users of agentic tools grew 7x and weekly agent requests grew 9.4x.
- Total AI spend has been relatively stable since April.
- With the model held constant, cost per 1,000 requests fell almost 34% from its peak and cost per session fell 52% from its June peak.
- More than 70% of Uber's pull requests are now attributed to local or cloud agents.
Uber didn't get there with caps or by taking tools away. It wrote spend down as six multiplied numbers, measured each one weekly, and pulled on four of them: cheaper models for subagents, a 1-hour prompt cache for idle engineers, tool search and CLIs instead of 70K tokens of MCP schemas, and code-mode scripts instead of one model turn per tool call.
This post walks through the equation, each lever and what it bought, and then a Python tutorial for the piece most teams are missing: a driver decomposition that tells you, with no unexplained residual, how much of last month's change in spend came from more users and how much from what each request costs.
Uber's numbers are from Uber's own post and describe its environment, not a controlled benchmark. The cache and decomposition examples below are illustrative, at October 10, 2026 list prices. None of this is Nadir customer data.
From budget blowout to flat bill.
The first half of 2026 was the year enterprises discovered what agents cost. Uber's budget story ran alongside Microsoft cancelling Claude Code licenses and Meta's internal token leaderboard, and the common response was a cap: a monthly dollar limit per engineer, a tool allowlist, a freeze. We argued at the time that caps are spending limits, not cost cuts. A cap stops the bill by stopping the work.
Uber's August post is the clearest public example of the other path. Usage kept growing. Unit cost fell. The bill stopped growing. And the post says plainly what it didn't do: the gains came from cutting zero-value tokens, "rather than relying only on cheaper unit prices or downgrading tools".
Spend is six numbers multiplied.
The core of the post is one line:
Total spend = users × sessions/user × turns/session × requests/turn × tokens/request × price/token
It sounds obvious. It's useful because every term has a different owner and a different lever, and two of them are terms you want to grow.
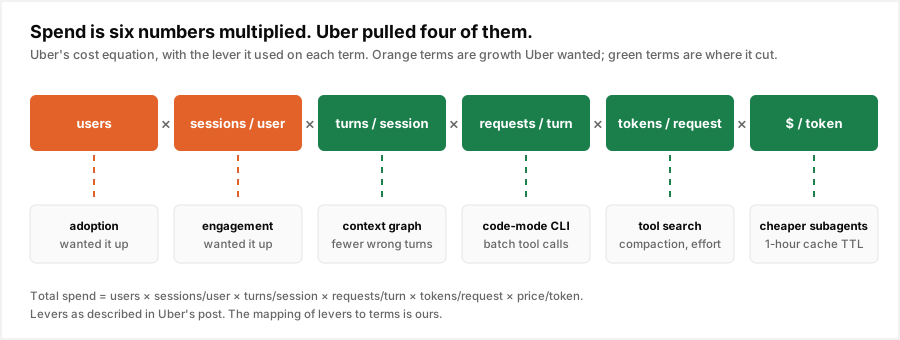
- Users and sessions per user are adoption and engagement. That's the point of the program. Cutting them is what a cap does.
- Turns, requests and tokens are the agent's own work, beyond what the engineer asked for. Uber calls these the main optimization targets.
- Price per token is set by the vendor, but which model runs each workload is your choice, and so is how much of the input is billed at cache-read rates.
Uber tracks this weekly and monthly at four levels: the portfolio (total attributed cost, users, spend share by tool), unit economics per tool (cost per 1,000 requests, tokens per request, cost per session, cost per active session hour, cache hit rate), model economics (cost and request share per model), and outcomes for managed agents (cost per merged PR, per review, per triaged alert, alongside revert rate, F1 and MTTR).
The fourth level is the one most dashboards skip. A coding agent's cost per request means little. Its cost per merged PR, next to its revert rate, is something a director can act on.
The four levers.
| Term | Lever | What Uber measured or changed |
|---|---|---|
| Price per token | Subagents default to a weaker, cheaper model | Called "the most impactful lever", and growing as more sessions use subagents |
| Price per token | 1-hour prompt cache TTL for interactive sessions | Idle gaps over 5 minutes stopped forcing full-price cache rebuilds |
| Tokens per request | Tool search and CLI instead of loading every MCP schema | 50K to 70K tokens of schemas removed from sessions with 100+ tools |
| Tokens per request | Compaction at 400K, reasoning effort default Medium | Compaction triggers even on 1M-context models |
| Requests per turn | Code-mode: tools as shell commands, batched in a script | 55% to 71% fewer tokens per query, over 90% on bulk workflows |
| Turns per session | AI Context Graph, 24M nodes and 80M edges | One lookup: 38 seconds, versus 20 minutes and a wrong answer without it |
Price per token: route the subagents.
Uber picks the Pareto-efficient model per workload, judged by cost per completed task, quality and reliability, using a four-step loop: build a benchmark from the agent's real work, run it on a harness that can serve any model, move to the Pareto-optimal option, and re-run as the frontier moves "every few weeks". For uReview, its AI code reviewer on every PR, the benchmark is real PRs with known bugs graded easy, medium and hard. Switching models raised F1 while sharply cutting cost per PR.
The biggest single lever, by Uber's account, is simpler: subagents default to a cheaper model, while the primary model decomposes the task and evaluates the results. Most subagent work is search, reading and summarizing, the kind of request a smaller tier handles. As more sessions fan out into subagents, more of the token volume lands on the cheap tier. It's the same split we described in the reasoning premium: pay flagship rates for the decisions, not for the legwork.
Price per token: a cache that survives lunch.
In Uber's post, cache reads cost 0.1x the input rate, and writes cost 1.25x for a 5-minute entry and 2x for a 1-hour entry. Uber noticed engineers routinely leave a session idle for more than five minutes, to read a diff, sit in a meeting or get coffee, and every return rebuilt the whole cached prefix at write prices. It moved interactive sessions to the 1-hour TTL and kept subagents, which are short-lived, on 5 minutes.
Here's what that's worth on a single session at Claude Sonnet 5.5 list prices, $2.50 per million for a 5-minute write, $4 for a 1-hour write and $0.10 for a read: a 100K-token prefix, five turns, ten minutes between each.
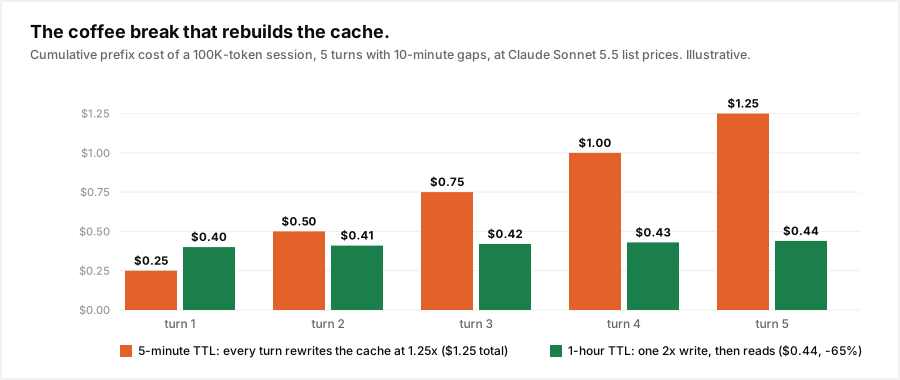
The 1-hour write costs more up front, $0.40 against $0.25, and pays for itself the first time an engineer comes back after six minutes. If turns arrive faster than five minutes apart, the 5-minute TTL wins, which is why the subagents keep it. If you're on the Anthropic API, it's one field:
system=[{
    "type": "text",
    "text": SYSTEM_PROMPT_AND_REPO_CONTEXT,
    "cache_control": {"type": "ephemeral", "ttl": "1h"},
}]
Uber's session dashboard example shows why this matters at fleet scale: across 433 sessions and $4,162 of spend, a 95% cache hit rate, and still $1,098 of cache-miss cost. We covered the other way the cache breaks, compaction rewriting the prefix, in compact now, pay later.
Tokens per request: stop reading every menu.
Standard MCP loads every tool schema into every session and re-sends it every turn. At Uber, sessions with 100+ tools carried 50,000 to 70,000 tokens of schemas before the engineer typed anything. SaaS vendors make it worse: one workspace suite ships 49 tools and about 22K tokens of schema, and messaging and project-tracking vendors ship 34 and 46. Two or three of those, the post notes, can cost more context than the file being edited.
Uber now routes all MCP traffic, more than 1,000 servers, through one gateway, and attacks the schema cost two ways. Tool search lets the model look up and load only the tools it needs. CLI resolution exposes every internal MCP tool as a shell command, resolved against the gateway at call time, which takes the schemas out of context entirely. PayPal reported a similar result in its SCOUT gateway paper: two meta-tools in place of a 2,000-tool catalogue cut tool tokens from about 140K to 1.3K. We priced the schema overhead in detail in the MCP tax.
Compaction and effort round this out. Uber compacts at 400K tokens even on 1M-context models, because a bigger window is also a bigger bill on every turn, and defaults reasoning effort to Medium, since reasoning tokens bill at output rates.
Requests per turn: code-mode.
With standard tool calling, a query against a data warehouse is a chain of model turns: submit, poll two to five times, retrieve, and the full result comes back into context. With tools exposed as shell commands, the model writes one script that does the loop in a subprocess, and only the summary returns.
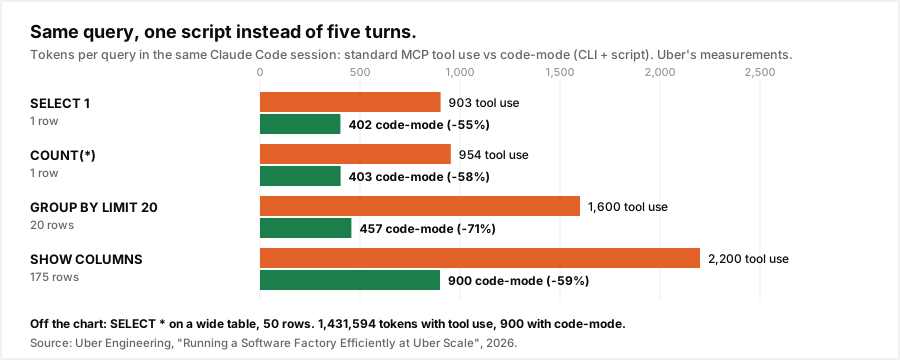
The small queries save 55% to 71%. The last row is the one to remember: a SELECT * on a wide table cost 1.43 million tokens through tool calls, because the rows landed in context and rode along on every later turn, and 900 through code-mode. Uber reports over 90% savings on bulk workflows that would otherwise take N turns, and ships more than 25 pre-built code-mode skills for its most-used MCP servers.
Turns per session: give the agent a map.
The last lever cuts wasted turns by answering "where is the thing" questions directly. Uber's AI Context Graph links 24 million nodes and 80 million edges from more than 30 internal systems: services, teams, incidents, PRs, design docs, deployments, datasets. In the post's example, an agent with the graph found the right table, used by 50+ analysts, and answered in 38 seconds. Without it, the agent ran for 20 minutes 9 seconds, spawned two subagents, hit three errors and concluded the dataset couldn't be queried.
That's the most expensive kind of agent run: long, confident and wrong.
Visibility without caps.
Uber explicitly avoids strict caps. Instead it gives engineers a live cost counter in the terminal status line, Slack nudges at 50%, 80% and 100% of expected spend, one shared spend tier across interactive harnesses rather than per-tool budgets, and manager sign-off to move up a tier.
It also runs a session analysis dashboard that flags 16 anti-patterns, each with a dollar impact and a fix. Four of them are worth checking in your own traces this week:
- Simple multi-turn sessions running on Opus that Sonnet could handle.
- Large MCP payloads, 40KB responses, re-billed on every later turn.
- Sessions resumed after long breaks, rebuilding the cache at full price.
- About 100,000 tokens of instructions and tool definitions loaded before the first user message.
Tutorial: which term moved your bill?
Uber's metric list includes a "driver decomposition" that splits each change in cost into adoption, engagement, input workload and output workload, "with no unexplained residual". Most teams can see that spend went up 11% last month. Few can say how much of that was new users, which is good news, and how much was fatter requests, which isn't.
The trick for an exact split is the log-mean Divisia index (LMDI), a standard method from energy economics. Each factor's contribution is a weighted log of its ratio, and because the logs of a product add up, the contributions sum exactly to the change. No residual, no ordering problem.
Step 1: collect six numbers per period.
From your gateway logs or provider usage exports, for each period: distinct users, sessions, model requests, input tokens, output tokens, and the input and output cost. If you don't attribute spend to users yet, our chargeback tutorial builds the tagging.
Step 2: decompose.
from math import log

def lmdi(a, b):
    """Log-mean weight. Exact when a == b, so the split never leaves a residual."""
    return a if abs(a - b) < 1e-12 else (a - b) / (log(a) - log(b))

def spend_parts(p):
    """Spend = users x sessions/user x requests/session x tokens/request x $/token,
    once for input tokens and once for output tokens."""
    shared = {
        "adoption": p["users"],
        "engagement": p["sessions"] / p["users"],
        "agent work": p["requests"] / p["sessions"],
    }
    parts = {}
    for side in ("input", "output"):
        f = dict(shared)
        f[f"{side} tokens/request"] = p[f"{side}_tokens"] / p["requests"]
        f[f"{side} $/token"] = p[f"{side}_cost"] / p[f"{side}_tokens"]
        parts[side] = (p[f"{side}_cost"], f)
    return parts

def decompose(before, after):
    out = {}
    pb, pa = spend_parts(before), spend_parts(after)
    for side in ("input", "output"):
        c0, f0 = pb[side]
        c1, f1 = pa[side]
        w = lmdi(c1, c0)
        for name in f0:
            out[name] = out.get(name, 0.0) + w * log(f1[name] / f0[name])
    total = (after["input_cost"] + after["output_cost"]) - (before["input_cost"] + before["output_cost"])
    for name, v in sorted(out.items(), key=lambda kv: -abs(kv[1])):
        print(f"{name:22s} {v:+12,.0f}")
    print(f"{'sum of drivers':22s} {sum(out.values()):+12,.0f}")
    print(f"{'actual change':22s} {total:+12,.0f}")
    return out
Turns per session are folded into "agent work" here, since most logs record requests, not turns. If yours record turns, add turns / sessions and requests / turns as two factors in shared and the sum still comes out exact.
Step 3: run it on two periods.
An illustrative week in February and one in August, shaped like Uber's: 7x the users, 9.4x the requests, and a bill that barely moved. The blended input price falls from $0.90 to $0.18 per million because the cache hit rate rose and subagents moved to a cheaper tier.
feb = dict(users=1_000, sessions=6_000, requests=300_000,
           input_tokens=9.0e9, output_tokens=0.15e9,
           input_cost=9.0e9 * 0.90 / 1e6, output_cost=0.15e9 * 10 / 1e6)
aug = dict(users=7_000, sessions=46_000, requests=2_820_000,
           input_tokens=45.1e9, output_tokens=0.85e9,
           input_cost=45.1e9 * 0.18 / 1e6, output_cost=0.85e9 * 3 / 1e6)
decompose(feb, aug)
adoption +19,630
input $/token -13,051
input tokens/request -5,101
output $/token -2,382
agent work +2,056
output tokens/request -1,001
engagement +918
sum of drivers +1,068
actual change +1,068Spend rose $1,068, from $9,600 to $10,668. Read the lines, not the total. Adoption alone would have added $19,630. Cheaper input tokens, from caching and cheaper subagents, took back $13,051, and leaner requests took back another $5,101. "Agent work", more requests per session, added $2,056, which is the term to watch: it's the agents doing more on their own, and it's the one that grows quietly when a new loop or retry policy ships.
Step 4: put it on a weekly report.
Run it per tool and per team, every week, against the prior week and the same week last month. Two rules make it useful:
- Hold the model constant when you judge an optimization. Uber did this deliberately, because a model upgrade changes tokens per request and price per token at once and hides what your own changes did. Run the decomposition on traffic from one model to measure a lever, and on all traffic to explain the bill.
- Alert on the bad terms, not the total. A total that rises because adoption doubled is a success. A total that's flat because adoption rose while tokens per request rose faster is a problem hiding in a good number.
What doesn't transfer.
- These are Uber's numbers. The post says so itself: the results are specific to Uber's environment and the method is what generalizes. There's no control group, and "relatively stable" spend has no published dollar figure.
- Scale buys tooling. A 1,000-server MCP gateway, a 24M-node context graph and a fleet-wide trace dashboard are platform-team projects. The cache TTL, the subagent default and the effort default are config changes anyone can make this week.
- Unit cost fell from a peak. The 34% and 52% are measured from the worst week, not from February. Measure your own from a fixed baseline.
Where Nadir fits.
Uber's roadmap lists "dynamic model routing" as a next step. Its biggest lever so far, a cheaper default model for subagents, is a static version of it: one rule for a whole class of requests. Per-request routing is the general version. Some subagent calls need the flagship, and many primary-agent turns don't.
Send model="auto" and Nadir's trained classifier reads each prompt and picks the tier from the models you've configured, against the quality floor you set on the API key. Each response reports the routing decision and its cost in the metadata, which is the per-request data the decomposition above needs, already attributed by key. If you'd rather keep calling providers yourself, POST /v1/bucket returns simple, medium or complex with a probability for each, so your harness can apply its own subagent rule with a measured signal instead of a guess.
The same caveat from Uber's cache lever applies: prompt caches are per model, so switching a long session's model mid-flight pays full price for the prefix. We wrote about that trade-off in your router is fighting your prompt cache. Route new sessions and subagents freely. Think twice before moving a warm one.
To see what routing would change on your own agents before it changes anything, Observe mode records the decision Nadir would make on every request without altering a single response. Start with a free key.
Conclusion.
Uber went from exhausting its AI budget in four months to growing agent usage 7x on a flat bill. It didn't cap anyone. It wrote spend as six multiplied numbers, decided which ones it wanted to grow, and cut the rest: cheaper models for subagents, a cache that survives an idle engineer, tools loaded on demand instead of 70K tokens of schemas, scripts instead of a model turn per tool call, and a map that stops agents wandering. Then it measured every term weekly, with the model held still. You don't need Uber's platform to start. You need the six numbers, the decomposition, and the discipline to cut the terms that don't do any work.
Sources: Uday Kiran Medisetty, ["Running a Software Factory Efficiently at Uber Scale"](https://www.uber.com/gb/en/blog/efficient-software-factory/), Uber Engineering, August 27, 2026; Uber Engineering, ["Designing Uber's MCP Gateway"](https://www.uber.com/us/en/blog/designing-mcp-gateway/), October 2, 2026; SCOUT hybrid semantic tool discovery, [arXiv 2608.23992](https://arxiv.org/abs/2608.23992). Found via [Token Cost Radar](https://jcodemunch.com/radar/2026-10-09), October 9, 2026. Claude Sonnet 5.5 list prices and cache multipliers as of October 10, 2026. The cache TTL example and the decomposition data are illustrative and are not Uber's figures. LMDI: B.W. Ang, "The LMDI approach to decomposition analysis", Energy Policy, 2005.